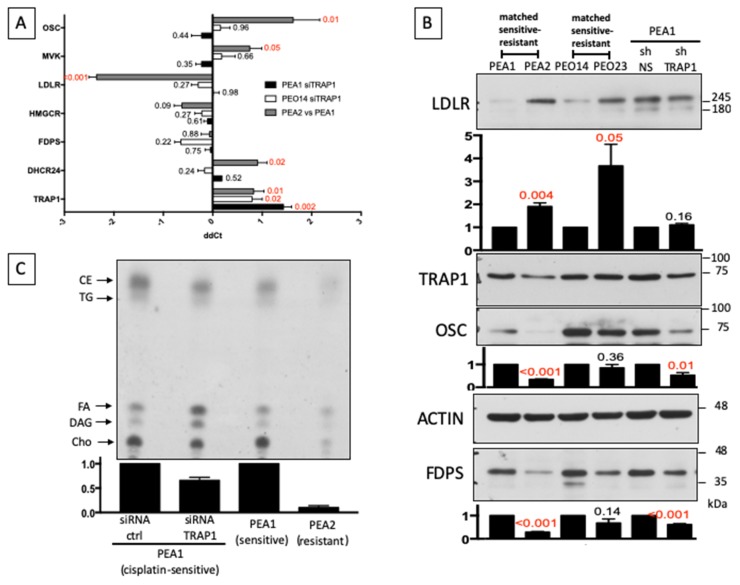
Figure 2.
Drug-resistant cells remodel cholesterol homeostasis. (A) Real-time RT-PCR analysis of expression of genes belonging to the cholesterol pathway in PEA1 and PEO14 upon siRNA-mediated TRAP1 silencing and in PEA2 compared to PEA1. All data are expressed as mean ± S.E.M. of delta-delta Ct (ddCt) from six (PEA1 siTRAP1), three (PEO14 siTRAP1), or four (PEA2 vs. PEA1) independent experiments with technical triplicates each. Numbers indicate the statistical significance (p-value), based on Student’s t-test (significant values highlighted in red). (B) Total lysates obtained from PEA1, PEA2, PEO14, and PEO23 cells or from stable TRAP1 knockdown PEA1 cells (shTRAP1) and their respective nonsilencing controls (shNS) were separated by SDS-PAGE and immunoblotted with the indicated antibodies. Images are representative of three independent experiments. Bar plots below panels show mean ± S.E.M. of relative densitometric band intensity calculated by assuming each band of the control condition (normalized on Actin) = 1 (n = 3). The number above the bars represent the statistical significance (p-value) based on the Student’s t-test (significant values highlighted in red). (C) [14C]-acetate incorporation in neo-synthesized lipids. Chromatogram of non-saponifiable lipids from PEA1 cells following siRNA-mediated TRAP1 silencing and from PEA1 and PEA2 cells, radiolabeled for 2 h. Cholesterol (Cho), diacylglycerols (DAG), fatty acids (FA), triacyglycerides (TG), and cholesteryl esters (CE) are indicated with arrows. Image is representative of two independent experiments. The bar plot shows mean ± S.E.M. of relative cholesterol densitometric band intensity calculated by assuming each band of the control condition = 1.

