Figure 3.
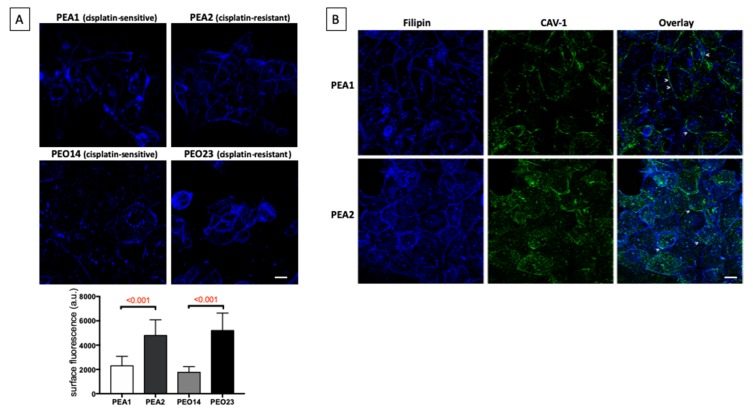
Transition to chemoresistance correlates with an increase of cholesterol at the cell surface. (A) Microscopy analysis of unesterified cholesterol through the visualization of filipin fluorescence in the two matched pair of cisplatin-sensitive/resistant cell lines PEA1/PEA2 and PEO14/PEO23. Maximum projection of Z-slices is shown. Scale bar = 20 μm. The bar graph (lower panel) shows the mean fluorescence intensity (arbitrary unit, a.u.) of filipin at the cell surface. Data are expressed as mean ± Standard deviation (SD) (n > 30). Numbers above bars indicate the statistical significance (p-value) based on Student’s t-test. (B) Representative images of double staining, in PEA1 and PEA2 cells, of unesterified cholesterol (Filipin) with Caveolin-1 (CAV-1). Overlay regions between filipin and CAV-1 stainings are indicated with arrowheads. Scale bar = 20 μm.

