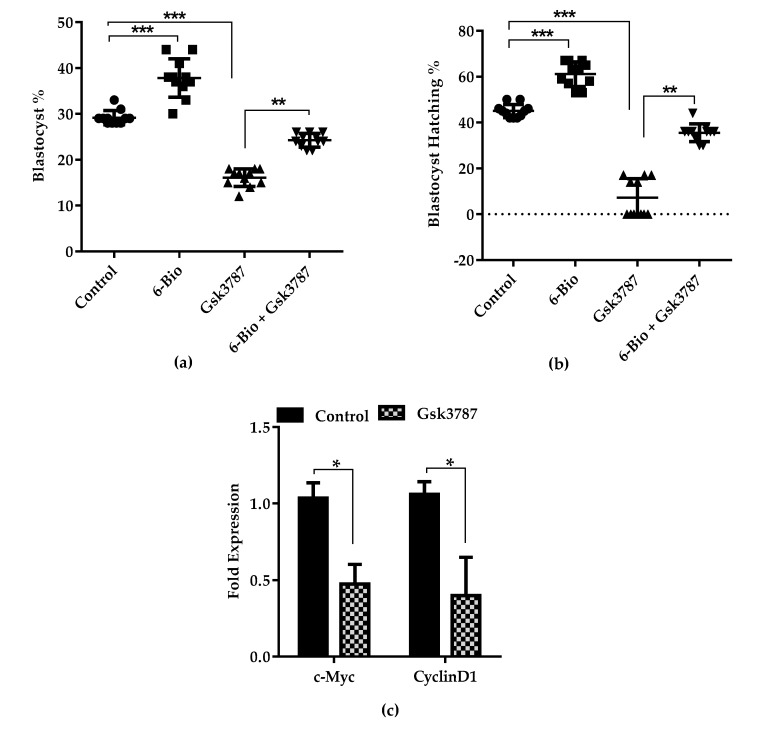
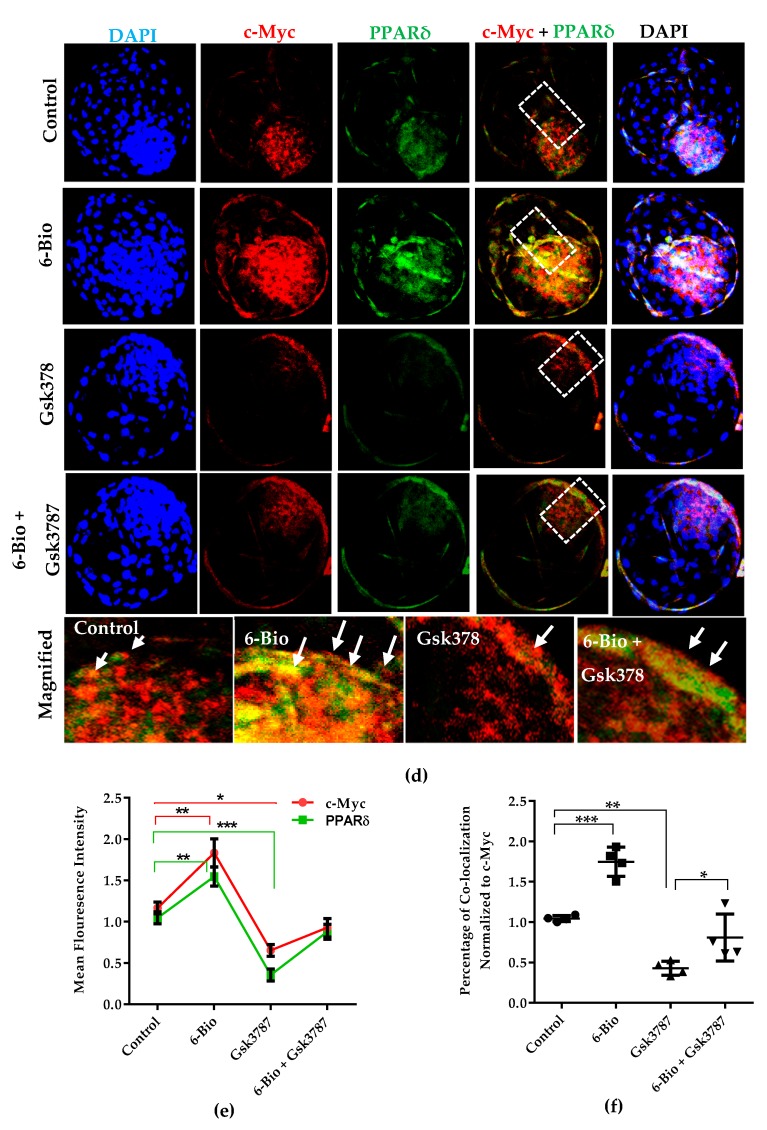
Figure 4.
Wnt induced PPARδ signaling upregulates c-Myc expression during bovine BL development. (a) Bar graphs represents the treatment of Wnt agonist (6-Bio; 400 nM), PPARδ antagonist (Gsk3787; 15 µM) and their co-treatment effect on bovine embryonic development to the BL stage. Data presented as a result of ± standard error of mean(SEM) from 11 replicates. (b) qRT-PCR analysis of c-Myc and CyclinD1 expression by Gsk3787 treated group. n = 5. (c) Immunofluorescence imaging showing co-localization of PPARδ (green) with c-Myc (red) in response to 6-Bio stimulation. Arrows indicate overlapping of PPARδ and c-Myc expression merge in Yellow. Nuclei counterstained with DAPI (blue). Higher magnification of the box regions shown at the bottom (d,e) Bar graph represent the quantification of mean fluorescence intensities and percentage of co-localization of PPARδ with c-Myc. All data are mean ± SEM from three independent sets of experiments (n = 20 BLs). * p < 0.05; ** p < 0.01; *** p < 0.001 indicates significant difference. Original magnification 100×.


