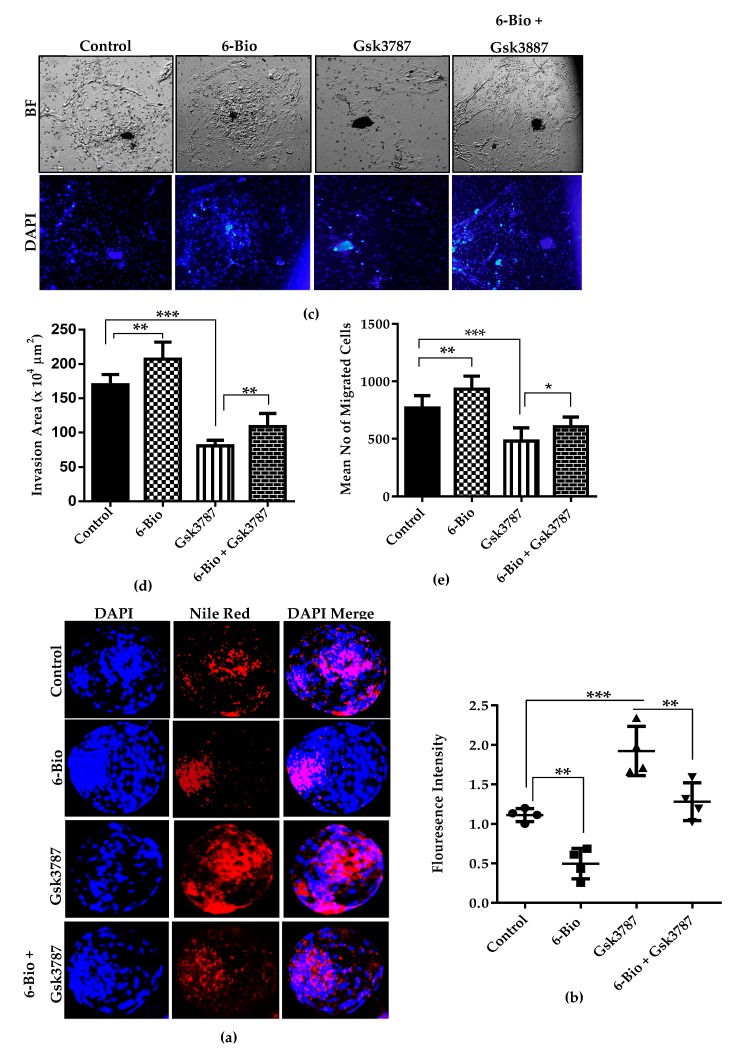
Figure 6.
The effect of Wnt activation on lipid accumulation and invading ability of BL trophectoderm cells. (a) Fluorescent Nile probe (red) staining in control, Wnt agonist (400 nM), PPARδ antagonist (15 µM) and combination of agonist + antagonist treated groups. (b) Quantification of mean fluorescence intensities shown in the graph. (c) Bright field images showing the invasion area of BLs cultured in 6-Bio, Gsk3787 and 6-Bio + Gsk3787 supplemented medium. (d) Representative bar graph shows the mean invasion area analyzed by image J software. (e) Bar graph present the mean number of migrated cells. Nuclei are stained in blue in all images. Data presented as means ± SEM from triplicate sets of experiment, including n = 20 BLs per group in each replicate. * p < 0.05; ** p < 0.01; *** p < 0.001 indicates significant difference. Original magnification 100×.

