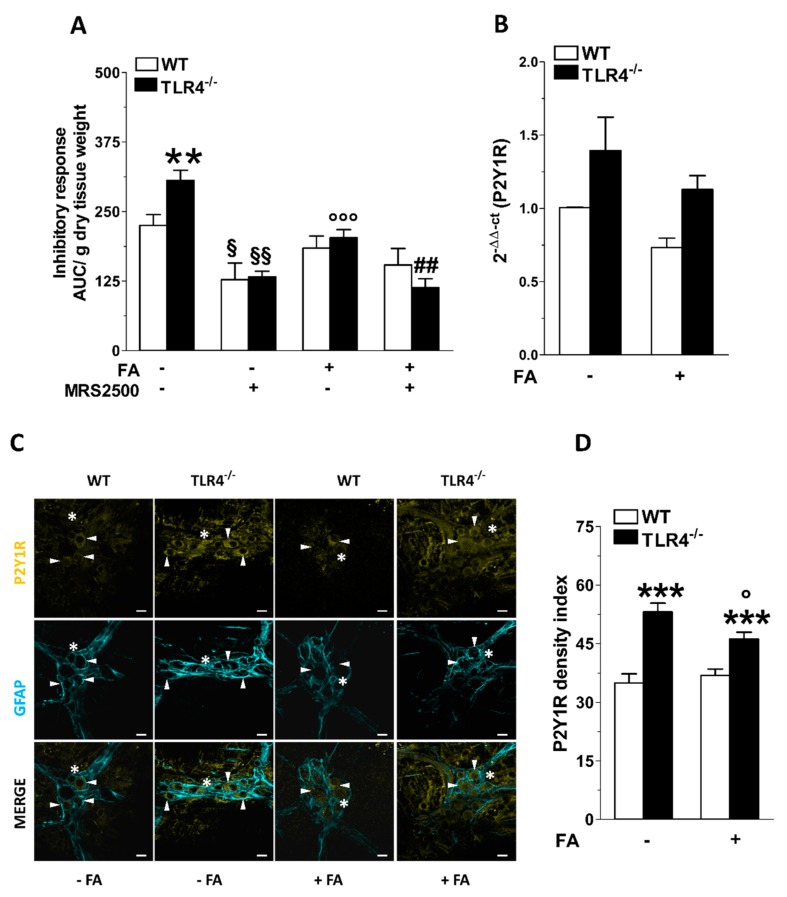
Figure 5.
TLR4 signaling and EGC activity affect P2Y1 receptor-mediated small intestinal relaxation. (A) 10 Hz EFS-evoked relaxation in NANC conditions with or without 10 μM FA or 10 μM MRS2500 (P2Y1R inhibitor) in ileal segments of WT and TLR4−/− mice. (B) qRT-PCR quantification of P2Y1R mRNA levels in small intestine segments of WT and TLR4−/− mice in the presence or absence of 10 μM FA. (C) Representative confocal microphotographs showing the distribution of P2Y1R (yellow) and GFAP (cyan) and (D) analysis of P2Y1R density index in ileal LMMPs of WT and TLR4-/- mice in the presence or absence of 10 μM FA (bars = 22 μm). White arrowheads indicate P2Y1+ neurons, stars indicate P2Y1+ glial cell bodies, respectively. Data are reported as mean ± SEM for all panels. ** P < 0.01, *** P < 0.001 vs. WT; ° P < 0.05, °°° P < 0.001 vs. respective control without FA; § P < 0.05, §§ P < 0.01 vs. respective control without MRS2500; ## P < 0.01 vs. respective control with FA and without MRS2500; N = 6 mice/group.

