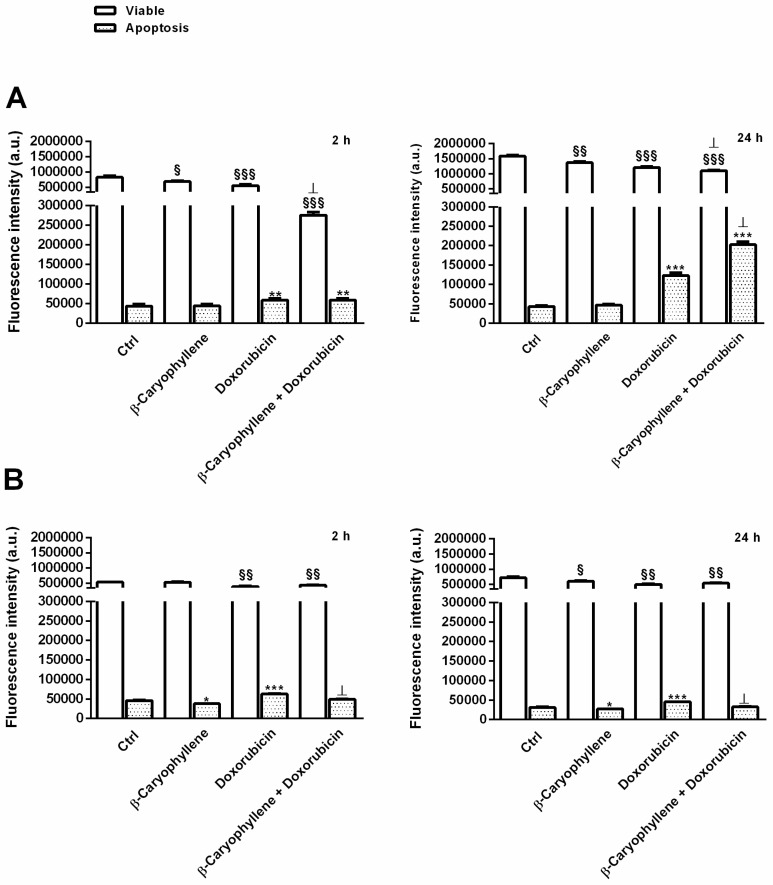
Figure 10.
Bar graphs (data expressed as mean ± standard error at least two independent replicates) of apoptosis induced by the natural sesquiterpene β-caryophyllene (50 µM), doxorubicin (20 µM) and their combination compared the control in Mz-ChA-1 cholangiocarcinoma cells (A) and H69 noncancerous cholangiocytes (B). The cells were treated for 2 h and 24 h, then the pellets were harvested and stained with Annexin-V-Cy3 and carboxyfluorescein diacetate (CFDA) for the cytofluorimetric analysis of apoptotic and viable cells (FL-2 for annexin and FL-1 for CF; BD AccuriTM C6 flow cytometer). Cells undergoing apoptosis were sorted by their typical forward- and side scatter (FSC-SSC) pattern, i.e., increased SSC and decreased FSC, respect to the viable cells. §p < 0.05, §§p < 0.01 and §§§p < 0.001 (one-way ANOVA followed by Dunnett’s multiple comparison post-test) denote a significant difference in the viable cells of the treatments compared the control. *p < 0.05, **p < 0.01 and ***p < 0.001 (one-way ANOVA followed by Dunnett’s multiple comparison post-test) denote a significant difference in the apoptotic cells of the treatments compared the control. ⊥p < 0.01 (t-Student test) denotes a significant difference with respect to doxorubicin.

