Abstract
In recent decades, there has been huge interest in exploring cost-effective and sustainable ways for energy production using fuel cells. In this study, different electrode materials, namely, nickel, stainless steel, brass, and graphite were used to investigate the energy production in double chamber microbial fuel cells. Yeast microorganisms (MOs) (Saccharomyces cerevisiae) were used at different concentrations for electricity production under different operating conditions with glucose as a substrate. The produced current and potential of the electrode were measured for ranges of operating conditions such as MO concentration (1–8 g/L), flow velocity (0–600 rpm), and aeration of the catholyte. It was found that there was a different performance exhibited by each electrode material, with nickel and graphite giving the highest efficiency. Increasing the flow velocity and aeration in the cathode compartment led to increasing the produced current while the flow and aeration in the anode compartment had a negative effect on the produced current. Simultaneous aeration and agitation gave high produced current values, while high agitation with aeration reduced the efficacy. The increased concentration of substrate glucose showed different influences on the produced current depending on electrode materials.
1. Introduction
Over many years, the world energy demand is in an increasing trend, which has caused escalating fuel prices. To cope with trends, efforts have been devoted to find out sustainable and low-cost methods for power generation.1 In addition, the rise in global temperature because of the emission of greenhouse gases has resulted in a high pollution level.2 Bioenergy sources which use biomass to produce energy such as in microbial fuel cells (MFCs) has gained wide attention from the researchers.3,4 MFCs provide a high potential for energy production as electricity.5 It has been shown from research studies over the years that the MFC performance is influenced by different operational and design parameters, such as electrode material, surface area of electrodes, nature of bacteria, types of substrate, and operating conditions such as solution pH, electrical conductivity, and hydrodynamics.6,7 Electrode cost and performance are very important in efficient MFC work. Therefore, a wide range of electrode materials and configurations have been investigated in the recent years to improve the performance of MFCs.8 The material of the electrode affects the energy loss in the fuel cells by the high internal resistance. The long operation time of electrodes is an important issue, but the most important is the electrode cost.9 The most commonly used anode materials are a range of carbon materials especially carbon paper, carbon cloth, and graphite because of their high specific surface area, acceptable conductivity, biocompatibility, and low cost.10,11
You et al. (2007)12 used different materials for energy production in MFCs and found that Pt is the optimum one compared to graphite and carbon cloth. Kasem et al. (2010)13 found that carbon cloth gives higher energy compared to carbon paper and porous carbon plate for MFCs using bakery yeast.
Because of its superior electrochemical, electrical, and mechanical properties, nickel was recommended as a successful cost-effective electrode for the use of electricity production in MFCs. Mardanpour and Yaghmaei (2016)14 used the nickel electrode for current production and a nonpathogenic strain of Escherichia coli in MFCs and obtained a maximum power density of 104 mW/m3. The authors stated that nickel is a promising electrode for electricity production in MFCs as it has been found to be suitable for biofilm growth. Baudler et al. (2015)15 found that up to 900 μA/m2 was generated on the nickel electrode in MFCs under anaerobic conditions with acetate as a substrate.
Rahimnejad et al. (2001)16 used continuous flow air–cathode MFCs with graphite plates for electricity generation with glucose as a substrate and produced up to 283 mW/m2. Yu et al. (2012)17 found that copper as an anode gives the lowest power density compared to aluminum and carbon clothes and carbon particles. The authors reasoned that the toxic effect of copper decreases the activity of bacteria. Accordingly, there are obvious contradictions of the results of the previous works regarding the effect of electrode materials on the energy output of MFCs, and thus the topic still needs further investigation and discussion. Birjandi et al. (2016)18 used medicinal herb wastewater in a dual-chamber MFCs with an aerobic cathode of a Fe@Fe2O3/graphite composite and produced a maximum power density of 49.8 mW/m2. Khan et al. (2020)19 used CNT/PPy-modified carbon paper electrodes for energy production in dual-chambered MFCs and obtained maximum power densities within a range of 469–651 mW/m3.
Few studies have investigated and analyzed the effect of hydrodynamics in the cathode or anode compartment on the overall MFC performance. In general, depending on the nature of MO and electrode materials, the fluid flow can have different effects whether it is used in a cathode or anode compartment. Fluid flow in the MFC is a key parameter that affects the distribution of substrates and the mass transfer rates, and it has not been well-characterized yet.20,21 Any little increase in oxygen concentration and flow velocity in the anode or cathode chamber can cause a significant effect on the produced energy in MFCs. The flow can increase the mass transfer of MO and dissolved oxygen toward the electrode surface which can affect the electrochemical behavior of the cell and consequently the produced power. However, flow in the biomass compartment erodes the biofilm and avoids the long contact between bacteria and electrode surface which reduces the MFC efficiency. So, it is important to study and analyze the effect of hydrodynamics in both cathode and anode sides on the power output of MFCs especially in the presence of aeration.
Yeast has been reported as an ideal biocatalyst for MFC applications because the majority of the strains are nonpathogens, which can metabolize a variety of substrates, are robust, and are easy to deal with.22 It has been reported that yeast strains Saccharomyces cerevisiae is able to produce electricity by degradation of the substrate in MFCs. The biocatalytic activity of the yeast is due to the existence of many natural electron shuttles, cytochromes, and mediators, that can be employed by redox enzymes for transferring the electrons from the yeast cells to the anode. The presence of high amounts of proteins in the yeast cell assists to enhance the electroactive characteristics.23−25 Christwardana and Kwon25 found that using yeast/CNT as a microbial catalyst in MFCs produces 344 mW/m2.
Accordingly, the electrode material has an important effect on the energy produced in MFCs, and the effect of hydrodynamics still needs further investigation to attain deeper insight for selecting the optimum operating conditions of MFC operation. Therefore, the objective of this work is to study the effect of the electrode material on the produced current in a MFC under different operational conditions including the role of aeration and fluid flow in catholyte or anolyte compartments. In addition, it is aimed to understand the effect trend of the potential of an electrode in both compartments with operating conditions to maximize the power output.
2. Materials and Methods
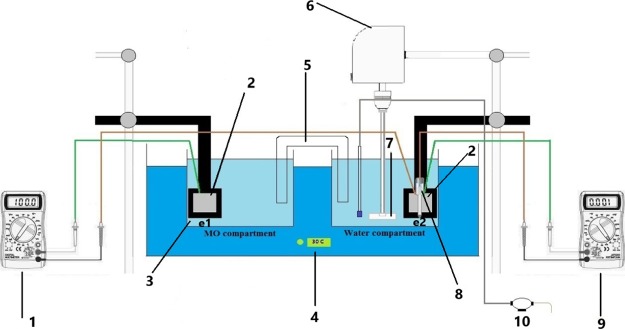
The schematic diagram of the used MFCs is shown in Figure 1. The unit was composed of two compartments: anode compartment and cathode compartment. The anode compartment contains the yeast (S. cerevisiae) microorganism (MO), and the cathode compartment contains water. The MO culture was prepared for 24 h in anaerobic conditions in an anaerobic jar vessel. The prepared medium for yeast culture consisted of yeast, glucose, and NaCl with a concentration of 5.6 g/L. The pH of the medium was kept on 6.8, and the inoculated cultures were incubated at 30 °C. The prepared culture was added to one compartment to serve as an anolyte. The solutions in both compartments contain 0.4 N NaCl salt to ensure high electrical conductivity. The concentration of MO in the anolyte compartment was changed from 1 to 8 g/L. Glucose as a substrate was added with a concentration of 0.1 g/L to the MO solution. Salt bridge was used to exchange protons through the electrolyte (water) which contains a 0.4 N NaCl solution. Electrons move along the outside through an external electrical connection between the two electrodes by copper wires. The investigated electrode materials were nickel, brass, stainless steel (SS), and graphite each of dimensions 40 mm × 40 mm × 0.5 mm (±0.1 mm). The water bath was used to maintain the solution temperature at 30 °C in each chamber. Electrode potentials were measured using standard calomel (SCE) under different operating conditions. Air was pumped in the catholyte (water chamber) for enhancing the current produced using an air pump at a rate of 2.5 L/min. A mechanical stirrer was used to provide the required agitation speeds (0–600 rpm). The agitator is equipped with a Ruston turbine impeller. The impeller had two blades of dimension 15 mm width, 30 mm long, and 4 mm thick. The electrodes were prepared for each run by washing with tap water, immersed in dilute HCl of 5% concentration for 3 min, washed with distilled water, and rinsed with ethanol. Then, one face of the electrodes was isolated with adhesive tape while the other face remained exposed to the solution. The electrodes were held in the solution by fixing them on a plastic board. The two compartments of MFCs were operated at the beginning of the work without bacteria to make sure that the cell current is zero. Then, the yeast MO was added into one compartment, mixed, and left for 15 min to let it grow and adapt to the temperature and the surrounding environment. Then, the experiment was started by short-circuiting the cell, and the current and electrode potentials were recorded with time for a time duration of 1 h. This time interval was used after performing preliminary experiments to deem the most suitable run duration. The pH, electrical conductivity, and oxygen solubility were measured for each solution under different operating conditions, as listed in Table 1. The chemical compositions of the metal electrode used are presented in Table 2, as obtained from scanning electron microscopy (SEM).
Figure 1.
(1) Ammeter, (2) electrode, (3) beaker, (4) water bath, (5) salt bridge, (6) stirrer, (7) impeller, (8) standard calomel electrode, (9) voltmeter, and (10) air pump.
Table 1. pH, Electrical Conductivity, and Dissolved Oxygen at 30 °C.
| pH | MO compartment (2 g/L) | 5.3 |
| water compartment | 6.3 | |
| dissolved oxygen (mg/L) | distilled water | 5.48 |
| 0.4 N NaCl solution | 5.92 | |
| distilled water + yeast MO (2 g/L) | 2.3 | |
| 0.4 N NaCl solution + air pumping (2.5 L/min) | 7.18 | |
| conductivity (μs/cm) | distilled water | 5 |
| 0.4 N NaCl solution | 5500 | |
| 0.4 N NaCl solution + yeast MO (2 g/L) | 6034 | |
| 0.4 N NaCl solution + air pumping | 3996 | |
| 0.4 N NaCl solution + stirring 600 rpm | 4789 | |
| 0.4 N NaCl solution + air pumping + stirring 600 rpm | 2372 |
Table 2. (a) Chemical Composition on Nickel Used wt %, (b) Chemical Composition on SS wt %, and (c) Chemical Composition on Brass wt %.
| (a) | ||||||
|---|---|---|---|---|---|---|
| Cu | Fe | Mn | C | Si | S | Ni |
| 0.24 | 0.38 | 0.33 | 0.14 | 0.32 | 0.01 | balance |
| (b) | ||||||||
|---|---|---|---|---|---|---|---|---|
| C | Mo | Cr | Mn | P | S | Si | N | Fe |
| 0.08 | 2 | 16 | 2 | 0.08 | 0.03 | 0.75 | 0.1 | balance |
| (c) | |||||||
|---|---|---|---|---|---|---|---|
| Cu | Al | Pb | Sn | Zn | Fe | Ni | Sn |
| 61.4 | 0.4 | 1.1 | 0.9 | 33.6 | 0.6 | 1.0 | 0.9 |
To evaluate the efficiency of each electrode from the corrosion standpoint, the corrosion rate (CR) was determined for three electrodes (all except graphite) using the weight loss method in the hardest operating conditions. To determine the CR, the electrodes were prepared according to the standard procedure for sample preparation for corrosion tests.26,27 The CR was determined using the following equation
| 1 |
where ΔW is the weight loss in gram, A is the area in m2, and t is the time in a day.
3. Results and Discussion
This section presents the Results and Discussion obtained for each electrode under different operating conditions.
3.1. Nickel Electrode
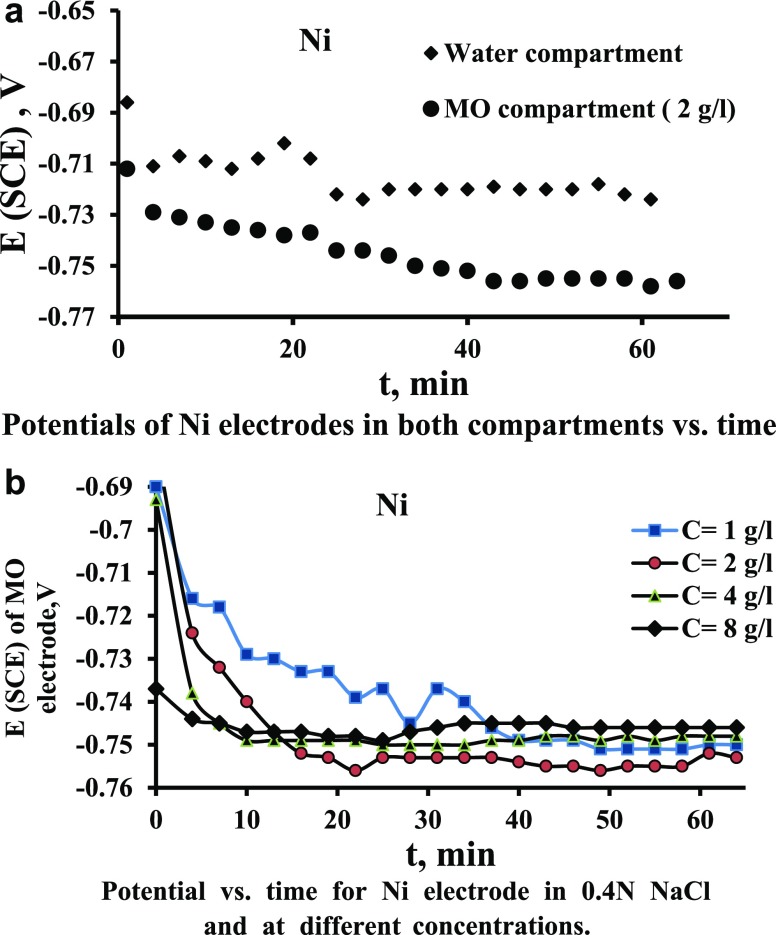
Investigating the trends of electrode potentials with the operating condition is helpful for understanding and analyzing the current output of the MFC. This is because the potential difference between the two compartments is an important factor influencing the produced current and, thus, the power output of the microbial cell. Figure 2a shows the potentials of the Ni electrodes in both compartments versus time. It is clear that the potential of the MO compartment is more negative than the water compartment. The departure of potentials from each other will increase the produced current. So, factors that cause a shift in the potential of the catholyte to more positive or a shift in the potential of the anolyte to more negative will increase the efficiency. Figure 2b shows the effect of MO concentration on the potential of the nickel electrode immersed in the MO solution versus time. From the figure, it is clear that when increasing the MO concentration from 1 to 2, it causes a shift in the potential to a more negative value.On further increasing the concentration, the potential shifts slightly to more positive. Bennetto et al. (1983)28 observed that the potential is shifted to a negative trend as a result of the microbial effect. The decreased anode potential was caused by the yeast MO that adheres to the anode surface.29 The accumulation of MO as a biofilm on the surface increases the resistance to the charge transfer which causes a shift in the potential to more negative, that is, resistance polarization occurs.30,31
Figure 2.
(a) Potentials of Ni electrodes in both compartments vs time. (b) Potential vs time for Ni electrode in 0.4 N NaCl and at different concentrations.
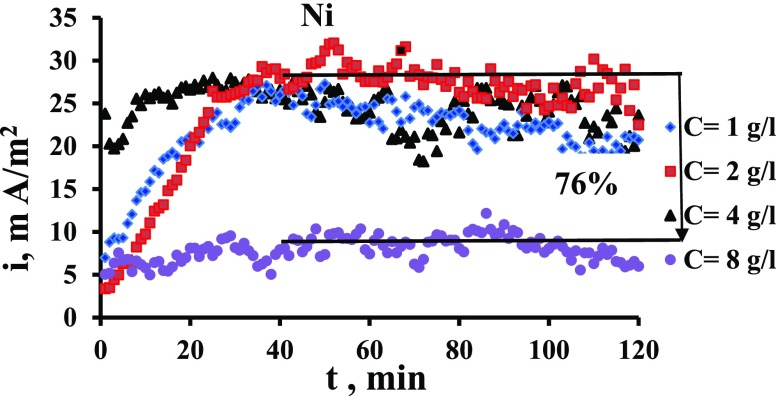
Figure 3 illustrates the effect of MO concentration on produced current density at T = 30 °C. It can be seen that when the concentration is increased from 1 to 2 g/L, the steady-state value of the produced current is increased. This is due to the increased produced electrons from the oxidation of MO at the anode. When the MO concentration is increased to 4, a slight decrease in the current occurs. With further increase to 8 g/L of MO, a clear decrease in current density occurs. The decrease in the current reaches up to 76% from a maximum value at 2 g/L. The reason is thought that the increased concentration of MOs leads to the formation of a separating layer of organisms (bio-fouling layer) on the electrode surface that is electrically inactive which resists the transfer of electrons produced from the oxidation of the organism. This agrees with the observation of Pons et al. (2011)32 who stated that the local (intrinsic) current density decreases with increasing biofilm coverage due to the formation of dense MO that locally provides lower current density.
Figure 3.
Current density vs time for Ni electrode in 0.4 N NaCl at T = 30 °C and at different concentrations.
It can be seen from Table 1 that the pH of MO compartments is lower than the water compartment. This difference in acidity can also increase the current produced due to the concentration cell effect.
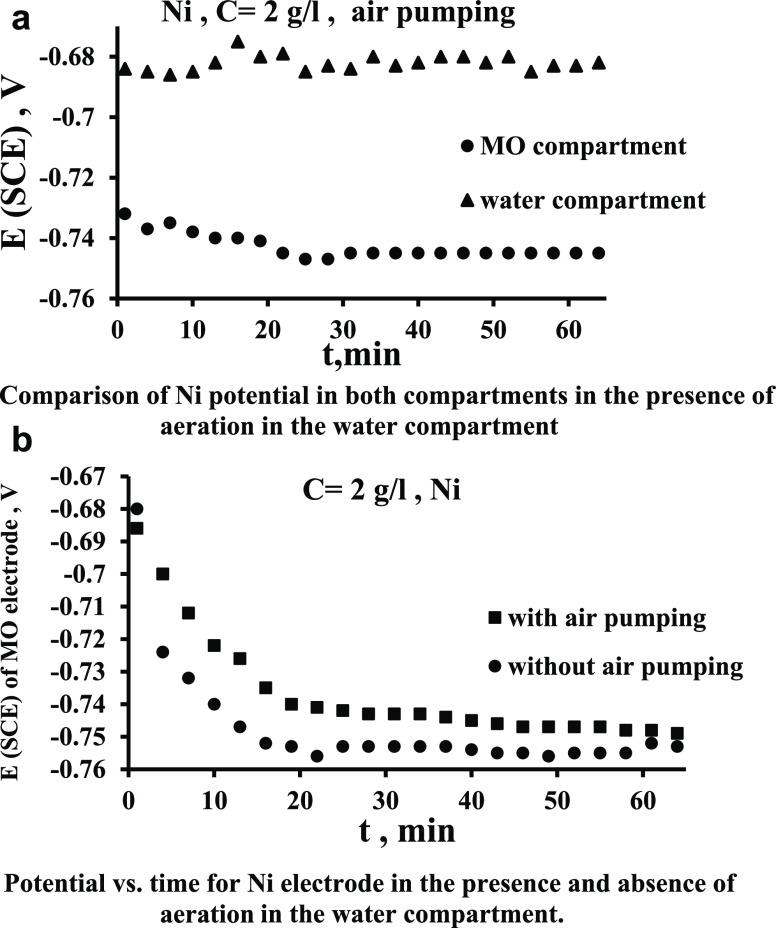
Figure 4a presents the variation of potentials of the Ni electrode in each compartment with the presence of aeration in the water compartment (catholyte). When comparing this figure with Figure 2a it can be seen that the aeration increased the potential difference between the two poles appreciably. In the case of Figure 2a, the steady-state potential difference is about 40 mV, while in the case of Figure 4a, the steady-state potential difference reaches up to 65 mV. This will enhance the produced current. Figure 4b shows the effect of aerating the water compartment on the potential of the nickel electrode in the MO compartment. It is evident that the potential shifts to more positive in case of air pumping (aeration) due to the increased dissolved oxygen concentration, as shown in Table 1. Oxygen has been the favorite option for electron acceptors because of the high potential and free availability, and therefore, air–cathode MFCs have been widely used for bioelectricity generation and other applications.33,34 However, a highly active electrocatalyst is required for the oxygen reduction reaction to ameliorate the sluggish reaction kinetics.35
Figure 4.
(a) Comparison of Ni potential in both compartments in the presence of aeration in the water compartment. (b) Potential vs time for the Ni electrode in the presence and absence of aeration in the water compartment.
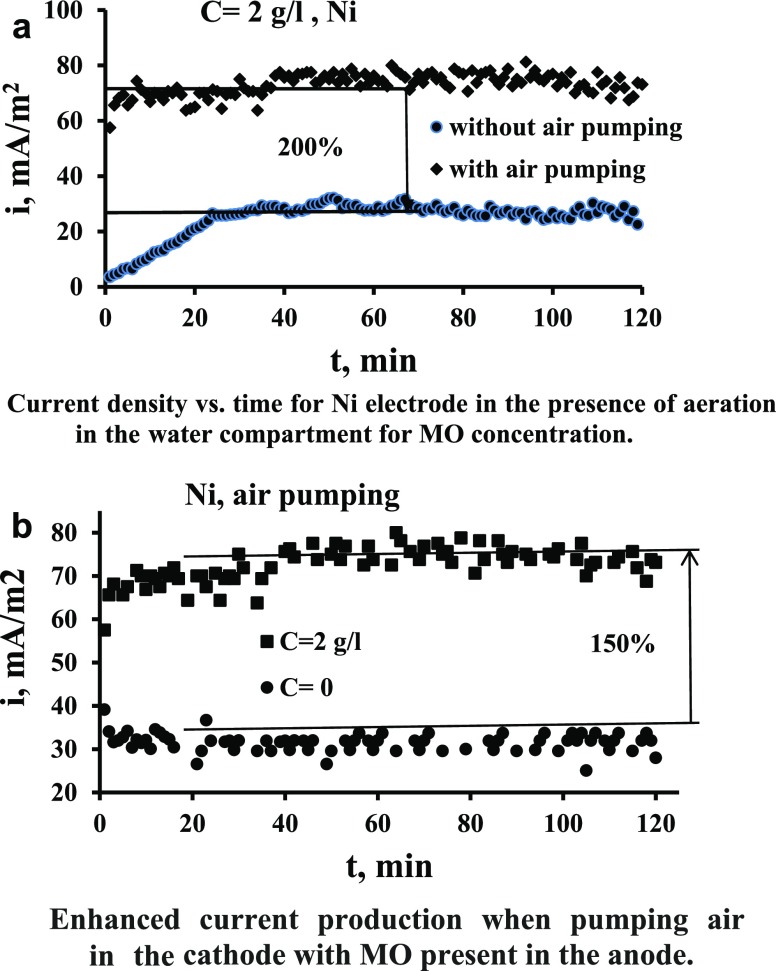
The increased oxygen concentration in the cathode chamber causes a shift in the potential on cathode to more positive,27,31 and thus the potential difference between anode and the cathode increases and thus more current generation produced from the oxidation of MO in the anode chamber, as indicated in Figure 5a. It is evident from Figure 5a that the effect of air pumping (aeration) in the water compartment increases the current produced by up to 2 times. The increased O2 concentration in the cathode chamber caused increased oxidation of MO in the anode chamber and more electron production and transfer that cause a reduction of O2 on the cathode surface.36Figure 5b shows a comparison between the case of air pumping in the cathode when the MO is present in the anode and when it is absent. It is clear how the presence of MOs in the anode enhanced the current compared to the case when the MO is absent. This indicates clearly the role of MOs for enhancing the current; the enhancement is by up to 150%. This large increase of the bacterial role is considered large compared with that present in the literature. In fact, the role of oxygen in catholyte in affecting the energy produced in MFCs is various in previous works. Some works found an increase in the produced energy28,37 while others9 found a decrease due to the oxygen transfer from cathode to anode.
Figure 5.
(a) Current density vs. time for the Ni electrode in the presence of aeration in the water compartment for MO concentration. (b) Enhanced current production when pumping air in the cathode with MO present in the anode.
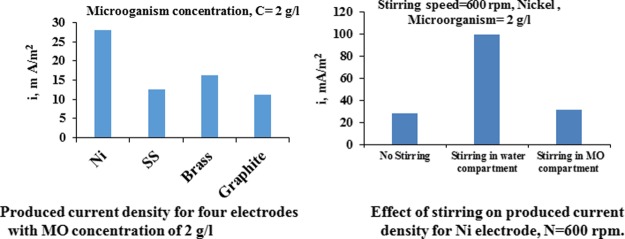
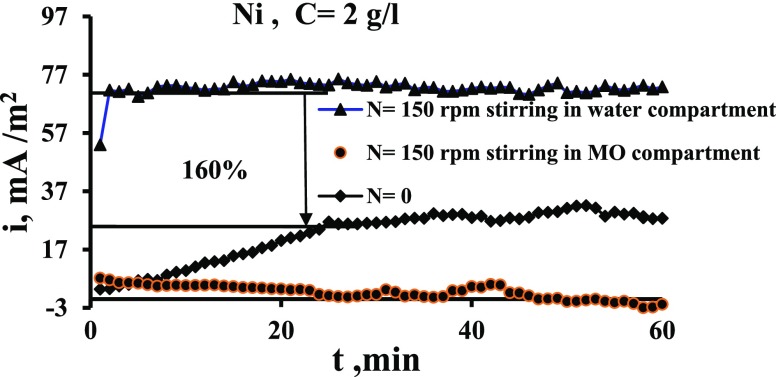
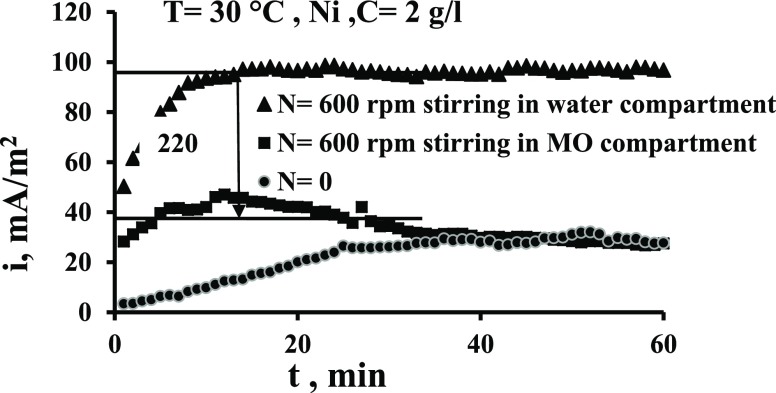
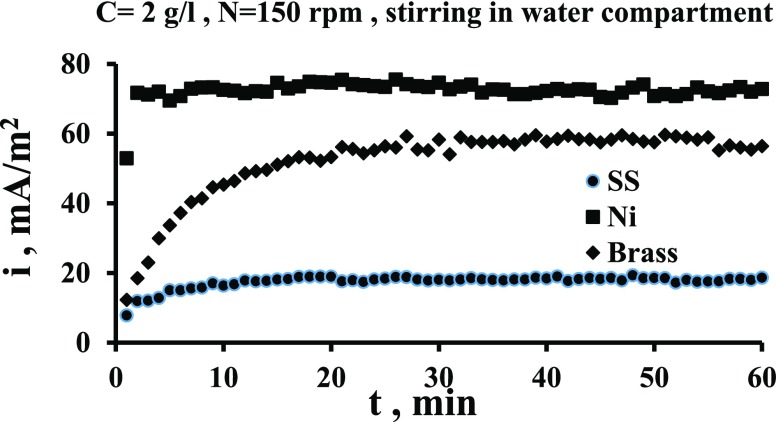
Figures 6 and 7 show the effect of stirring speed on the current output when the stirring is in the cathode compartment time and in the anode compartment other time. These figures indicate that the current increases appreciably when the stirring is imposed in the catholyte (water). Figure 6 indicates that the increase in current is up to 1.6 times while Figure 7 indicates that i increases by up to 2.2 times. This is because the stirring increases the cathode potential due to the increased transport of oxygen to the surface, as has been evidenced by previous works,29,36,38 and thus the potential difference between two electrodes is increased. Bennetto et al.28 stated that the potential of the anode is influenced by low amounts to O2 that transfer through the membrane from the catholyte which shifts the potential to more positive. The authors also noticed a fall in the current to nearly zero. It is thought that oxygen destroys the effectiveness of the coupling mechanism, normally responsible for the stable anode potentials and cell emf observed under anaerobic conditions.33Figures 6 and 7 show also that the solution flow in the anode compartment (MO compartment) causes a reduction in the current. This is because of different reasons. First, the yeast is anaerobic bacteria; so, the increased O2 transport to the surface reduces its activity at the surface. Second, the flow causes an increase in the potential of anode, and thus the potential difference between the two compartments is decreased leading to the decrease in the current of the cell. Third, the flow shear force removes the MO layer from the surface.
Figure 6.
Comparison of the effect of stirring in two compartments on current density vs time for the Ni electrode for N = 150 rpm.
Figure 7.
Comparison of the effect of stirring in two compartments on current density vs time for the Ni electrode for N = 600 rpm.
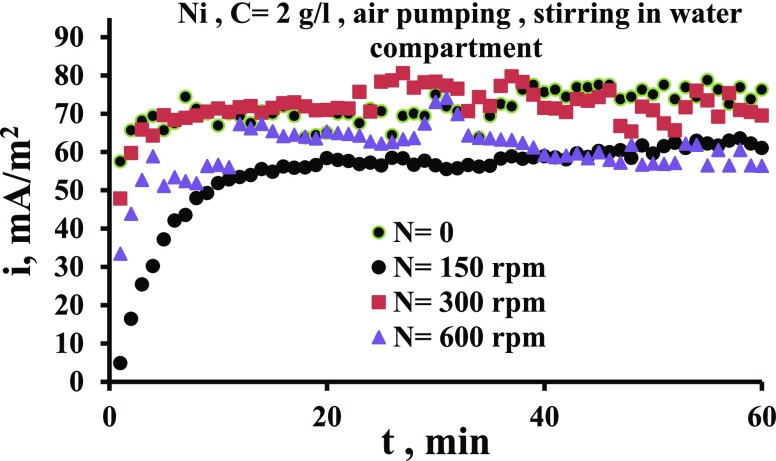
Figure 8 shows the effect of solution stirring at a different speed in the water compartment with air pumping. The air pumping and fluid flow together in the cathode chamber increase the concentration of dissolved oxygen by breaking the air bubbles into smaller bubbles. This is due to the energy dissipated from the impeller and shear forces provided by the flow.39,40 At high speeds, the high turbulence level associated with the high velocities drives more air bubbles toward the electrode surface. This causes more collisions between bubbles and the electrode. The presence of bubbles close to the surface increases the electrical resistance, and thus the current decreases, as can be seen for the case of 600 rpm where the current is less compared to 150 and 300 rpm. Table 1 shows how the aeration with flow reduces the conductivity of the solution at high speeds, as listed in Table 1. The breakage of air bubbles by the energy dissipated from the impeller leads to an increase in the number of bubbles in the solution,39,40 which in turn reduces the electrical conductivity.
Figure 8.
Current density vs time for the Ni electrode for various agitation speeds in the presence of air pumping in the water compartment.
3.2. Comparison of Performance of Different Electrodes
This section presents a comparison of the performance of four electrodes investigated here under selected operating conditions.
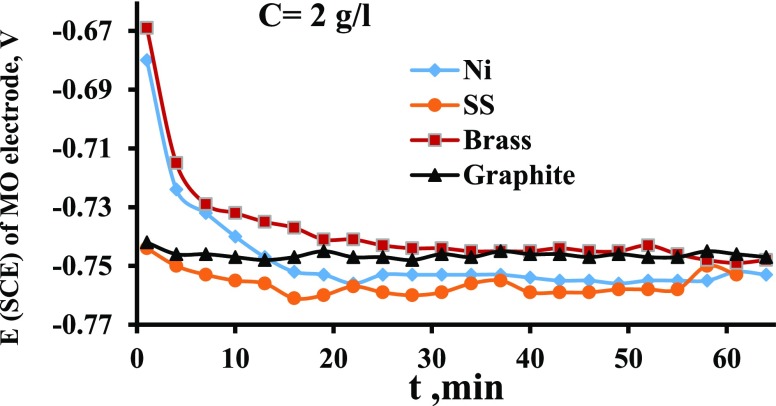
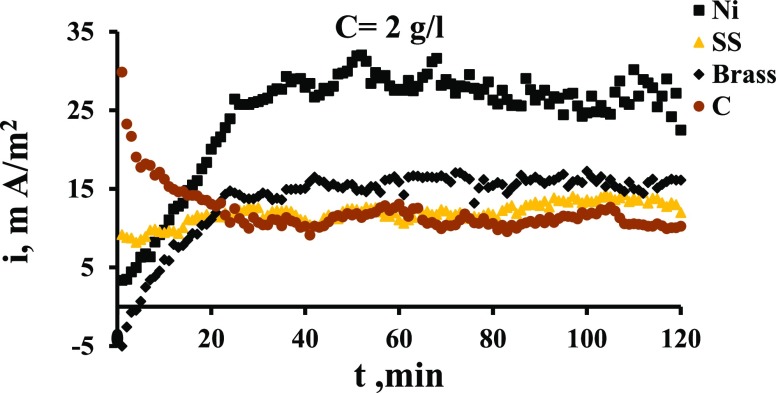
Figure 9 shows the potential of different electrodes in the MO compartment (e1). It is evident that brass gives the highest potential, indicating its high electrochemical properties for the current generation and transfer. The high potential increases the possibility of MO oxidation on the electrode surface. It can be seen also from Figure 9 that the potential of nickel and graphite are comparable while SS has the lowest potential. In general, the potential besides other physical properties (such as electrical conductivity, surface roughness, and porosity) plays an important role in determining the electrode efficiency from a current production standpoint. The produced current density values on each electrode are presented in Figure 10. This figure indicates clearly that Ni gives the highest values of produced current, followed by brass, graphite, and SS. If the graphite is considered the baseline, Figure 10 indicates that at steady state, the SS gives current higher than graphite by about 20%, brass by 50%, and nickel by 150%.
Figure 9.
Potential vs time for four electrodes MO concentration of 2 g/L and T = 30 °C.
Figure 10.
Current density vs time for four electrodes, MO concentration of 2 g/L.
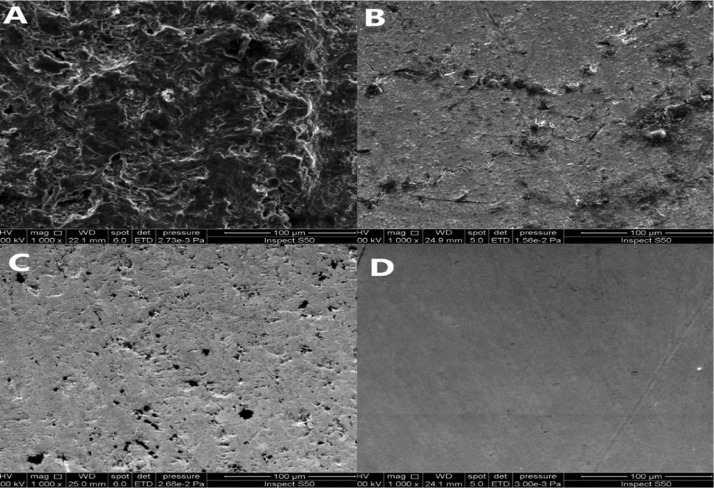
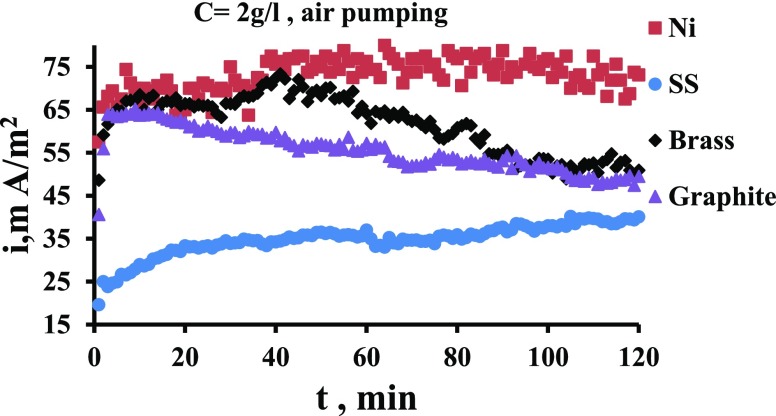
This difference between the values of current produced on each electrode material is ascribed to different factors that determine the capability of each electrode to produce current. First is the electrochemical potential of the electrode which influences the capability of the electrode to oxidize the MO and extract the electrons. The more positive electrode potential is the more possibility of extracting electrons from the MO side. Second is the electrical conductivity of the electrode which determines the capability of transferring the electrons produced from bacterial oxidation. Table 3 lists the values of the conductivity of each electrode. It can be seen that both brass and nickel have the highest electrical conductivity followed by SS and graphite. The high electrical conductivity certainly enhanced the performance of nickel and brass by facilitating the current flow. Third is the porosity of the electrode surface which affects the surface area exposed to the MO solution. Graphite has the highest porosity, as shown in the SEM image in Figure 11. The images show clearly the high roughness and pores of graphite compared to other electrodes, while SS seems to be the smoothest surface. This is why the graphite is preferred often as an electrode in MFCs. The disadvantage of graphite is its low electrical conductivity.15 Fourth is the adhesion properties of the electrode surface. It has been demonstrated that the surface roughness plays an important role in increasing the mass (or heat) transport due to the high surface area of contact and high turbulence level in case of flow conditions.31,41−44 Therefore, graphite produces the highest current due to the high surface area exposed to the MO solution. The poor performance of SS has also been reported with an excellent one for copper.15 The rough surface may provide a suitable situation for the MO to stick and grow to form the biofilm. Overall, the interaction between these four factors gives the electrode its own capability to support the cell performance depending on the prevailing operating conditions. However, the cost of each material should be considered in the design of the MFC. Graphite and brass are providing an advantage of relatively lower cost compared to other materials investigated in present work.
Table 3. Electrical Conductivity of Electrodes at 20 °C45.
| material | conductivity (S/m) |
|---|---|
| nickel | 1.43 × 10⁷ |
| brass | 1.59 × 10⁷ |
| SS | 1.45 × 10⁶ |
| graphite | 3.3 × 10² |
Figure 11.
SEM images for electrode surface: (A) graphite, (B) brass, (C) nickel, and (D) SS.
Figure 12 shows the current density for four electrodes with air pumping in the water compartment (catholyte). It is indicated that the maximum current density was still for the nickel electrode followed by brass, but the performance of graphite becomes better than SS. This is attributed to the fact that the presence of pores in graphite facilitates the O2 diffusion through these pores and thus withdraw more electrons from the anode compartment. In addition, the high surface area of graphite causes the O2 to increase the potential difference between the two terminals of the cell and thus more MO oxidation. Figure 13 shows the effect of fluid flow (150 rpm) in the catholyte compartment on the produced current for different electrodes. Underflow conditions, the nickel is still the highest followed by brass and SS.
Figure 12.
Current density vs time for four electrodes in the presence of aeration in the water compartment MO concentration of 2 g/L.
Figure 13.
Current density vs time for four electrodes shows the effect of stirring speed 150 rpm.
Table 4 presents the CR of three metallic electrodes in both the MO compartment and the water compartment. It can be seen that the Ni has superior corrosion properties while brass is the worst and SS is moderate. The high efficiency by brass weakens by its low corrosion resistance properties. In general, the CR is considered acceptable when compared with that of carbon steel in 0.05 N NaCl solution which is 318 gmd.44
Table 4. CR at 30 °C of Different Electrodes in Both Anolyte and Catholyte.
| electrodes | CR, gmd for the water chamber (catholyte) | CR, gmd in the MO chamber (anolyte) |
|---|---|---|
| Ni | 0 | 0.375 |
| SS | 0.75 | 0.75 |
| brass | 1.875 | 2.625 |
3.3. Effect of Substrate Concentration
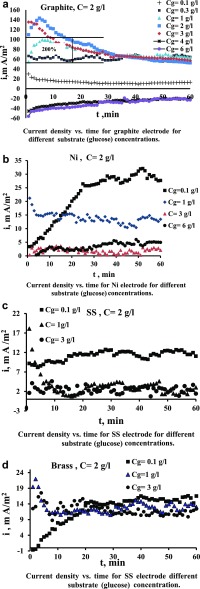
Figure 14a shows the effect of increasing glucose concentration on current density. It can be seen that the current increases considerably with increasing glucose concentration; the initial increase reaches up to 140 mA/m2. The steady-state value of current density increases with increasing glucose concentration to 3 g/L by about 2 times. With a further increase in glucose concentration to 4 and 6 g/L, the current sharply decreases to below zero. The drop of current to negative values indicates the polarity reversals; that is, the MO compartment becomes cathode, and the water compartment becomes anode. The initial increase of the glucose substrate concentration leads to an increase in the current because the MO degrades the substrate on the surface of the electrode producing more electrons, as shown in eq 2(46−48)
| 2 |
Figure 14.
a) Current density vs time for the graphite electrode for different substrate (glucose) concentrations. (b) Current density vs time for the Ni electrode for different substrate (glucose) concentrations. (c) Current density vs time for the SS electrode for different substrate (glucose) concentrations. (d) Current density vs time for the SS electrode different substrate (glucose) concentration.
For the high concentrations of glucose, there is a decrease in current density due to the blockage of pores on the electrode surface that prevents the arrival of bacteria and current to the surface. In addition, the high amount of glucose reduces the electrical conductivity of the solution, leading to a decrease of current. Sayed et al. (2012)29 suggested the possibility of saturation of the microbial solution at a concentration which may explain the decline of power density when the MFC was fed with a high concentration of the substrate. The high concentration of the substrate might be toxic to the electrochemically active bacteria, which results in lower power densities, and most of the substrate remained unconsumed at high concentrations.50
Figure 14b–d shows the effect of glucose concentration on current density using nickel, SS, and brass electrodes, respectively. It can be seen that the increase in the substrate concentration leads to a decrease in the current density. The reason is that the glucose sticks on the electrode surface, and the MO is no longer able to transfer the electrons to an anode. It seems that the effect of a substrate is dependent on the adhesion properties of the metal and its roughness. Figure 15 shows the thick layer formed on the electrode surface.
Figure 15.
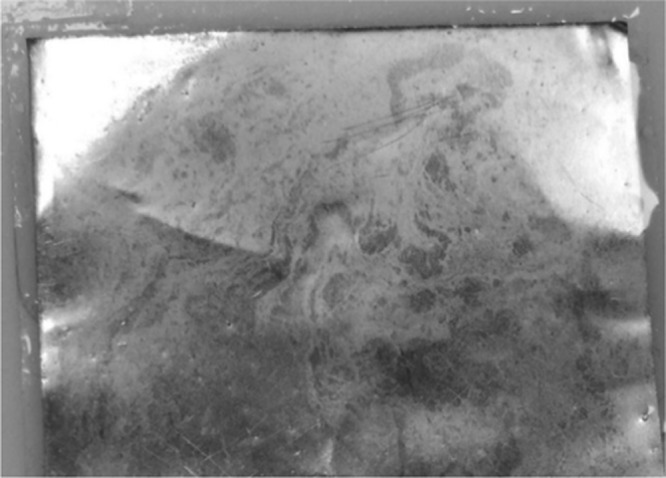
Photograph of the layer of MO and glucose formation on the Ni electrode at a concentration of MO 2 g/L with a glucose concentration of 3 g/L.
Table 5 presents the values of the produced power density in the present work at selected experimental conditions. Brass is not included in Table 4 because of the high CR. Table 6 presents values from the literature to compare with the values of this work in Table 5. The power density from the present work without stirring or air pumping is within the ranges present in the literature. Under aeration and flow conditions in the cathode chamber, the power is appreciably enhanced and large compared to previous work. The large values compared to previous work is ascribed to high activity of MO (yeast) and electrode materials used in the present work.
Table 5. Power Density at Optimum Conditions for C = 2 g/L.
| type of electrode | experiment conditions | I, mA/m2 | P, mW/m2 |
|---|---|---|---|
| Ni | T = 30 °C | 28.1 | 361.2 |
| T = 30 °C, air pumping | 75 | 1597.5 | |
| T = 30 °C, air pumping, N = 600 rpm | 68.8 | 2263.5 | |
| SS | T = 30 °C | 12.5 | 103.8 |
| T = 30 °C, air pumping | 35.0 | 514.5 | |
| graphite | T = 30 °C | 11.3 | 93.5 |
| T = 30 °C, air pumping | 50.0 | 1153 |
Table 6. Maximum Generated Power and Current of MFC with Different Types of MOs from Previous Works.
| references | electrode type | electrode geometry and dimensions | current density (mA/m2) | power density | MO | substrate |
|---|---|---|---|---|---|---|
| Rabaey, Ossieur, et al.,50 | graphite granules as the anode and graphite as the cathode | anode is graphite granules 3 mm diam., cathode is graphite felt electrodes (8 × 4 × 0.4 cm) | 479 mW/m3 | mixed consortium | glucose, sucrose | |
| Ringeisen et al., (2006)51 | vitreous carbon (RVC) as anode and cathode | reticulated vitreous carbon RVC electrodes of 37 cm2 | 44.4 | 22.2 mW/m2 | Shewanella oneidensis | lactate |
| Thygesen et al. (2009)52 | carbon anode and cathode | fat plat electrode, 3 × 8, 0.035 cm | 85 | 28 mW/m2 | domestic wastewater | glucose |
| carbon anode and cathode | flat plat electrode, 3 × 8, 0.035 cm | 589 | 123 mW/m2 | domestic wastewater | acetate | |
| carbon anode and cathode | flat plat electrode, 3 × 8, 0.035 cm | 145 | 32 mW/m2 | domestic wastewater | xylose | |
| Ghoreyshi et al.(2011)49 | graphite felt as anode and cathode | graphite felt in dimensions of 50 × 35 × 2 mm | 1600 | 190 mW/m2 | S. cerevisiae | glucose |
4. Conclusions
The electrode material has a significant effect on the performance of a MFC. This is related to several properties such as the electrode electrical conductivity, surface area exposed to the solution, and electrochemical potential. Nickel is found to be a successful electrode material as it gave high current density with a very low CR. Brass gives relatively good values of current but its CR is relatively high. Graphite and SS are lower but corrosion-resistant. At steady state, the SS gives current higher than graphite by about 20%, brass by 50%, and nickel by 150%. The MO concentration between 1 and 2 g/L is typical for the high current production. Higher concentrations cause a reduction in the produced current. When the concentration becomes 8 g/L, the reduction in current is about 76%, which is due to the accumulation of MO on the electrode surface. The gentle aeration of the catholyte under stationary conditions causes an increase in the produced current by up to 2 times. The agitation of the catholyte by 600 rpm increases the steady-state value of the current produced by 2.2 times while the agitation of the anolyte causes an appreciable decrease in the current. In general, simultaneous aeration and agitation cause a considerable increase in the current, but the high agitation speed with aeration causes a reduction in the current due to small air bubble dispersion in the catholyte leading to reduced electrical conductivity. The influence of increasing glucose substrate concentration on the produced current is dependent on the electrode material and surface nature. For the graphite electrode, when the glucose concentration increases up to 3 g/L, the current increases by about 2 times. For metallic electrodes: nickel, SS, and brass, the presence of glucose as a substrate reduces the current appreciably. This is thought mainly due to the adhesion of glucose on the electrode surfaces which increases the electrical resistance and avoids the electrons transfer.
Glossary
Nomenclature
- C
concentration of yeast, mg/L
- Cg
concentration of glucose, mg/L
- i
bio current density, A/m2
- t
time, s
- T
temperature, °C
- A
area, m2
- W
weight, g
Subscripts
- g
glucose
Abbreviations
- MO
microorganism
- SS
stainless steel
The authors declare no competing financial interest.
References
- Feng Y.; Kayode O.; Harper W. F. Using Microbial Fuel Cell Output Metrics and Nonlinear Modeling Techniques for Smart Biosensing. Sci. Total Environ 2013, 449, 223–228. 10.1016/j.scitotenv.2013.01.004. [DOI] [PubMed] [Google Scholar]
- Voiland A.Second Warmest Year on Record; End of Warmest Decade; NASA Goddard Institute for Space Studies, 2011, https://www.nasa.gov/topics/earth/features/temp-analysis-2009.html (accessed March 22, 2020).
- Zhou M.; Chi M.; Wang H.; Jin T. Anode Modification by Electrochemical Oxidation: A New Practical Method to Improve the Performance of Microbial Fuel Cells. Biochem. Eng. J. 2012, 60, 151–155. 10.1016/j.bej.2011.10.014. [DOI] [Google Scholar]
- Nguyen C.-L.; Tartakovsky B.; Woodward L. Harvesting Energy from Multiple Microbial Fuel Cells with a High-Conversion Efficiency Power Management System. ACS Omega 2019, 4, 18978–18986. 10.1021/acsomega.9b01854. [DOI] [PMC free article] [PubMed] [Google Scholar]
- Mohan S. V.; Mohanakrishna G.; Reddy B. P.; Saravanan R.; Sarma P. N. Bioelectricity Generation from Chemical Wastewater Treatment in Mediatorless (Anode) Microbial Fuel Cell (MFC) Using Selectively Enriched Hydrogen Producing Mixed Culture under Acidophilic Microenvironment. Biochem. Eng. J. 2008, 39, 121–130. 10.1016/j.bej.2007.08.023. [DOI] [Google Scholar]
- Oh S.-E.; Logan B. E. Proton Exchange Membrane and Electrode Surface Areas as Factors That Affect Power Generation in Microbial Fuel Cells. Appl. Microbiol. Biotechnol. 2006, 70, 162–169. 10.1007/s00253-005-0066-y. [DOI] [PubMed] [Google Scholar]
- Kim J. R.; Cheng S.; Oh S.-E.; Logan B. E. Power Generation Using Different Cation, Anion, and Ultrafiltration Membranes in Microbial Fuel Cells. Environ. Sci. Technol. 2007, 41, 1004–1009. 10.1021/es062202m. [DOI] [PubMed] [Google Scholar]
- Wei J.; Liang P.; Huang X. Recent Progress in Electrodes for Microbial Fuel Cells. Bioresour. Technol. 2011, 102, 9335–9344. 10.1016/j.biortech.2011.07.019. [DOI] [PubMed] [Google Scholar]
- Davis F.; Higson S. P. J. Biofuel cells—recent advances and applications. Biosens. Bioelectron. 2007, 22, 1224–1235. 10.1016/j.bios.2006.04.029. [DOI] [PubMed] [Google Scholar]
- Pham T. H.; Aelterman P.; Verstraete W. Bioanode Performance in Bioelectrochemical Systems: Recent Improvements and Prospects. Trends Biotechnol. 2009, 27, 168–178. 10.1016/j.tibtech.2008.11.005. [DOI] [PubMed] [Google Scholar]
- Logan B. E.; Hamelers B.; Rozendal R.; Schröder U.; Keller J.; Freguia S.; Aelterman P.; Verstraete W.; Rabaey K. Microbial Fuel Cells: Methodology and Technology. Environ. Sci. Technol. 2006, 40, 5181–5192. 10.1021/es0605016. [DOI] [PubMed] [Google Scholar]
- You S.; Zhao Q.; Zhang J.; Jiang J.; Wan C.; Du M.; Zhao S. A Graphite-Granule Membrane-Less Tubular Air-Cathode Microbial Fuel Cell for Power Generation under Continuously Operational Conditions. J. Power Sources 2007, 173, 172–177. 10.1016/j.jpowsour.2007.07.063. [DOI] [Google Scholar]
- Kasem E. T.; Saito Y.; Tsujiguchi T.; Nakagawa N.. Effect of Anode Material on the Performance and Characteristics of Ragi Operated Microbial Fuel Cell. The 2nd International Conference on Energy Engineering ICEE-2; Gunma University: Japan, 2010.
- Mardanpour M. M.; Yaghmaei S. Characterization of a microfluidic microbial fuel cell as a power generator based on a nickel electrode. Biosens. Bioelectron. 2016, 79, 327–333. 10.1016/j.bios.2015.12.022. [DOI] [PubMed] [Google Scholar]
- Baudler A.; Schmidt I.; Langner M.; Greiner A.; Schröder U. does it have to be carbon? Metal anodes in microbial fuel cells and related bio-electrochemical systems. Energy Environ. Sci. 2015, 8, 2048. 10.1039/c5ee00866b. [DOI] [Google Scholar]
- Rahimnejad M.; Ghoreyshi A. A.; Najafpour G.; Jafary T. Power generation from organic substrate in batch and continuous flow microbial fuel cell operations. Appl. Energy 2011, 88, 3999–4004. 10.1016/j.apenergy.2011.04.017. [DOI] [Google Scholar]
- Yu D.-y.; Wang G.; Xu F.-c.; Chen L.-m. Constitution and Optimization on the Performance of Microbial Fuel Cell Based on Sulfate-Reducing Bacteria. Energy Procedia 2012, 16, 1664–1670. 10.1016/j.egypro.2012.01.258. [DOI] [Google Scholar]
- Birjandi N.; Younesi H.; Ghoreyshi A. A.; Rahimnejad M. Electricity generation through degradation of organic matters in medicinal herbs wastewater using bio-electro-Fenton system. J. Environ. Manage. 2016, 180, 390–400. 10.1016/j.jenvman.2016.05.073. [DOI] [PubMed] [Google Scholar]
- Khan N.; Anwer A. H.; Ahmad A.; Sabir S.; Sevda S.; Khan M. Z. Investigation of CNT/PPy-Modified Carbon Paper Electrodes under Anaerobic and Aerobic Conditions for Phenol Bioremediation in Microbial Fuel Cells. ACS Omega 2020, 5, 471–480. 10.1021/acsomega.9b02981. [DOI] [PMC free article] [PubMed] [Google Scholar]
- Yi Y.; Xie B.; Zhao T.; Qian Z.; Liu H. the effect of anode hydrodynamics on the sensitivity of microbial fuel cell based biosensors and the biological mechanism. Bioelectrochemistry 2020, 132, 107351. 10.1016/j.bioelechem.2019.107351. [DOI] [PubMed] [Google Scholar]
- Kim J.; Kim H.; Kim B.; Yu J. Computational fluid dynamics analysis in microbial fuel cells with different anode configurations. Water Sci. Technol. 2014, 69, 1447–1452. 10.2166/wst.2014.041. [DOI] [PubMed] [Google Scholar]
- Sayed E. T.; Abdelkareem M. A.. Yeast as a Biocatalyst in Microbial Fuel Cell; INTECH, Open Science, December 13, 2017. [Google Scholar]
- Schaetzle O.; Barrière F.; Baronian K. Bacteria and yeasts as catalysts in microbial fuel cells: Electron transfer from micro-organisms to electrodes for green electricity. Energy Environ. Sci. 2008, 1, 607–620. 10.1039/b810642h. [DOI] [Google Scholar]
- Sayed E. T.; Tsujiguchi T.; Nakagawa N. Catalytic activity of baker’s yeast in a mediatorless microbial fuel cell. Bioelectrochemistry 2012, 86, 97–101. 10.1016/j.bioelechem.2012.02.001. [DOI] [PubMed] [Google Scholar]
- Christwardana M.; Kwon Y. Yeast and carbon nanotube based biocatalyst developed by synergetic effects of covalent bonding and hydrophobic interaction for performance enhancement of membraneless microbial fuel cell. Bioresour. Technol. 2017, 225, 175–182. 10.1016/j.biortech.2016.11.051. [DOI] [PubMed] [Google Scholar]
- Najafpour G.; Rahimnejad M.; Ghoreshi A. The Enhancement of a Microbial Fuel Cell for Electrical Output Using Mediators and Oxidizing Agents. Energy Sources, Part A 2011, 33, 2239–2248. 10.1080/15567036.2010.518223. [DOI] [Google Scholar]
- Shrier L. L.Corrosion: Metal/Environment Reactions, 3rd ed.; Newes-Butten Worths: London, 2000. [Google Scholar]
- Bennetto H. P.; Stirling J. L.; Tanaka K. Anodic Reactions in Microbial Fuel Cells. Biotechnol. Bioeng. 1983, 25, 559–568. 10.1002/bit.260250219. [DOI] [PubMed] [Google Scholar]
- Sayed E. T.; Tsujiguchi T.; Nakagawa N. Catalytic Activity of Baker’s Yeast in a Mediatorless Microbial Fuel Cell. Bioelectrochemistry 2012, 86, 97–101. 10.1016/j.bioelechem.2012.02.001. [DOI] [PubMed] [Google Scholar]
- Mahato B. K.; Cha C. Y.; Shemilt L. W. Unsteady State Mass Transfer Coefficients Controlling Steel Pipe Corrosion under Isothermal Flow Conditions. Corros. Sci. 1980, 20, 421–441. 10.1016/0010-938x(80)90010-4. [DOI] [Google Scholar]
- Slaimana Q. J. M.; Hasan B. O. Study on Corrosion Rate of Carbon Steel Pipe under Turbulent Flow Conditions. Can. J. Chem. Eng. 2010, 88, 1114–1120. 10.1002/cjce.20383. [DOI] [Google Scholar]
- Pons L.; Délia M.-L.; Bergel A. Effect of surface roughness, biofilm coverage and biofilm structure on the electrochemical efficiency of microbial cathodes. Bioresour. Technol. 2011, 102, 2678–2683. 10.1016/j.biortech.2010.10.138. [DOI] [PubMed] [Google Scholar]
- He Y.-R.; Du F.; Huang Y.-X.; Dai L.-M.; Li W.-W.; Yu H.-Q. Preparation of Microvillus-like Nitrogen-Doped Carbon Nanotubes as the Cathode of a Microbial Fuel Cell. J. Mater. Chem. A 2016, 4, 1632–1636. 10.1039/c5ta06673e. [DOI] [Google Scholar]
- Ghasemi M.; Wan Daud W. R.; Hassan S. H. A.; Jafary T.; Rahimnejad M.; Ahmad A.; Yazdi M. H. Carbon Nanotube/Polypyrrole Nanocomposite as a Novel Cathode Catalyst and Proper Alternative for Pt in Microbial Fuel Cell. Int. J. Hydrogen Energy 2016, 41, 4872–4878. 10.1016/j.ijhydene.2015.09.011. [DOI] [Google Scholar]
- Hasan B. O. “Galvanic Corrosion of Aluminum–Steel under Two-Phase Flow Dispersion Conditions of CO2 Gas in CaCO3 Solution”. J. Pet. Sci. Eng. 2015, 133, 76–84. 10.1016/j.petrol.2015.05.007. [DOI] [Google Scholar]
- Oh S.; Min B.; Logan B. E. Cathode performance as a factor in electricity generation in microbial fuel cells. Environ. Sci. Technol. 2004, 38, 4900–4904. 10.1021/es049422p. [DOI] [PubMed] [Google Scholar]
- Slaiman Q. J. M.; Hasan B. O.; Mahmood H. A. Corrosion inhibition of carbon steel under two-phase flow (water-petroleum) simulated by turbulently agitated system. Can. J. Chem. Eng. 2008, 86, 240–248. 10.1002/cjce.20027. [DOI] [Google Scholar]
- Hasan B. O. Experimental study on the bubble breakage in a stirred tank. Part 1. Mechanism and effect of operating parameters. Int. J. Multiphase Flow 2017, 97, 94–108. 10.1016/j.ijmultiphaseflow.2017.08.006. [DOI] [Google Scholar]
- Hasan B. O. Experimental study on the bubble breakage in a stirred tank Part 2: Local dependence of breakage events. Exp. Therm. Fluid Sci. 2018, 96, 48–62. 10.1016/j.expthermflusci.2018.02.013. [DOI] [Google Scholar]
- Förster M.; Augustin W.; Bohnet M. Influence of the Adhesion Force Crystal/Heat Exchanger Surface on Fouling Mitigation. Chem. Eng. Process. 1999, 38, 449–461. 10.1016/s0255-2701(99)00042-2. [DOI] [Google Scholar]
- Crittenden B. D.; Alderman N. J. Negative Fouling Resistances: The Effect of Surface Roughness. Chem. Eng. Sci. 1988, 43, 829–838. 10.1016/0009-2509(88)80078-2. [DOI] [Google Scholar]
- Hasan B. O.; Jwair E. A.; Craig R. A. the effect of heat transfer enhancement on the crystallization fouling in a double pipe heat exchanger. Exp. Therm. Fluid Sci. 2017, 86, 272–280. 10.1016/j.expthermflusci.2017.04.015. [DOI] [Google Scholar]
- Majdi H. S.; Alabdly H. A.; Hasan B. O.; Hathal M. M. Oil fouling in double-pipe heat exchanger under liquid-liquid dispersion and the influence of copper oxide nanofluid. Heat Tran. Asian Res. 2019, 48, 1963–1981. 10.1002/htj.21473. [DOI] [Google Scholar]
- Ali M. E. M.Experimental study on the corrosion behavior of carbon steel and selected metals in petroleum refinery wastewater. M.Sc. Thesis, Department of Chemical Engineering, Al-Nahrain University, Iraq, 2019. [Google Scholar]
- Southard M. Z.; Green D. W.. Perry’s Chemical Engineers Handbook, 7th ed.; McGraw-Hill: New York, 2018. [Google Scholar]
- Christgen B.Electricity Generation from Wastewater Using Microbial Fuel Cells: A Study of Electrode and Membrane Materials. Ph.D. Thesis, School of Chemical Engineering and Advanced Materials, Newcastle University, 2011. [Google Scholar]
- Rahimnejad M.; Adhami A.; Darvari S.; Zirepour A.; Oh S.-E. Microbial fuel cell as new technology for bioelectricity generation: A review. Alexandria Eng. J. 2015, 54, 745–756. 10.1016/j.aej.2015.03.031. [DOI] [Google Scholar]
- Jong B. C.; Kim B. H.; Chang I. S.; Liew P. W. Y.; Choo Y. F.; Kang G. S. Enrichment, Performance, and Microbial Diversity of a Thermophilic Mediatorless Microbial Fuel Cell. Environ. Sci. Technol. 2006, 40, 6449–6454. 10.1021/es0613512. [DOI] [PubMed] [Google Scholar]
- Ghoreyshi A. A.; Jafary T.; Najafpour G. D.; Haghparast F.. Effect of Type and Concentration of Substrate on Power Generation in a Dual Chambered Microbial Fuel Cell. World Renewable Energy Congress-Sweden, May 8–13, 2011; pp 1174–1181.
- Rabaey K.; Ossieur W.; Verhaege M.; Verstraete W. Continuous Microbial Fuel Cells Convert Carbohydratesto Electricity. Water Sci. Technol. 2005, 52, 515–523. 10.2166/wst.2005.0561. [DOI] [PubMed] [Google Scholar]
- Ringeisen B. R.; Henderson E.; Wu P. K.; Pietron J.; Ray R.; Little B.; Biffinger J. C.; Jones-Meehan J. M. High Power Density from a Miniature Microbial Fuel Cell Using Shewanella Oneidensis DSP10. Environ. Sci. Technol. 2006, 40, 2629–2634. 10.1021/es052254w. [DOI] [PubMed] [Google Scholar]
- Thygesen A.; Poulsen F. W.; Min B.; Angelidaki I.; Thomsen A. B. The Effect of Different Substrates and Humic Acid on Power Generation in Microbial Fuel Cell Operation. Bioresour. Technol. 2009, 100, 1186–1191. 10.1016/j.biortech.2008.07.067. [DOI] [PubMed] [Google Scholar]


