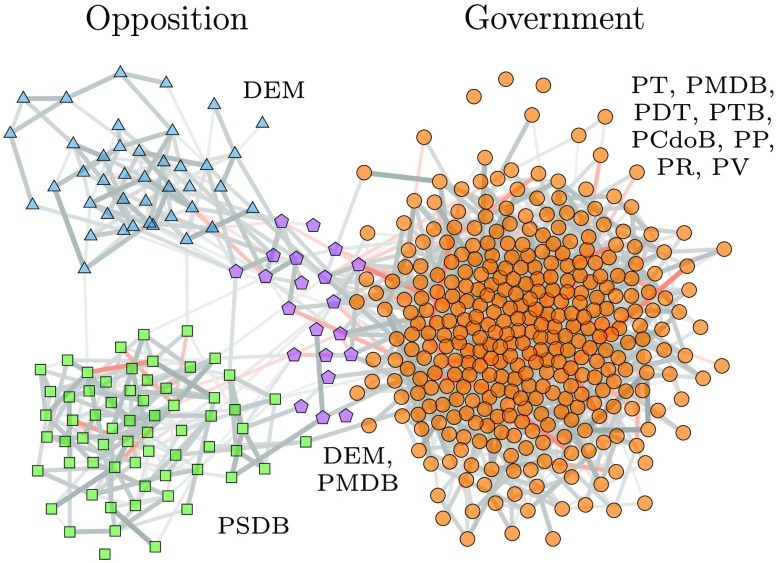
FIG. 4.
Reconstruction of the interactions between members of the lower house of the Brazilian congress from the voting patterns of the 2007–2011 session, according to the Ising model. The node colors indicate the inferred groups. The edge thickness shows the posterior probability for each edge, and the color shows the magnitude of the coupling . The labels show the most frequent party membership for each group.

