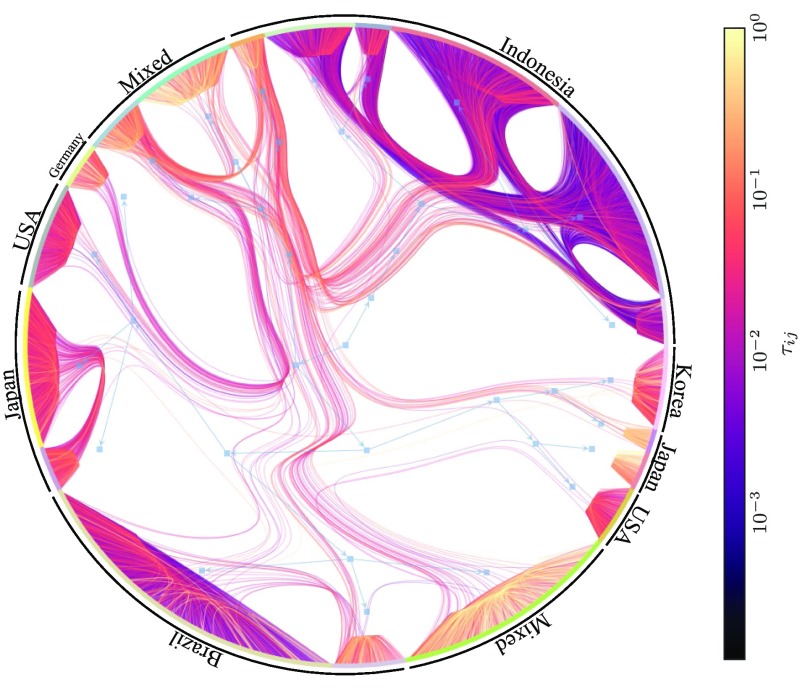
FIG. 5.
Reconstruction of the directed network of influence between twitter users from 58224 retweets, using a SI infection model. The hierarchical division represents the inferred fit of the nested DC-SBM (see Refs. [51,52] for details on the layout algorithm), and the edge colors indicate the infection probabilities as shown in the legend. The text labels show the dominating country membership for the users in each group.

