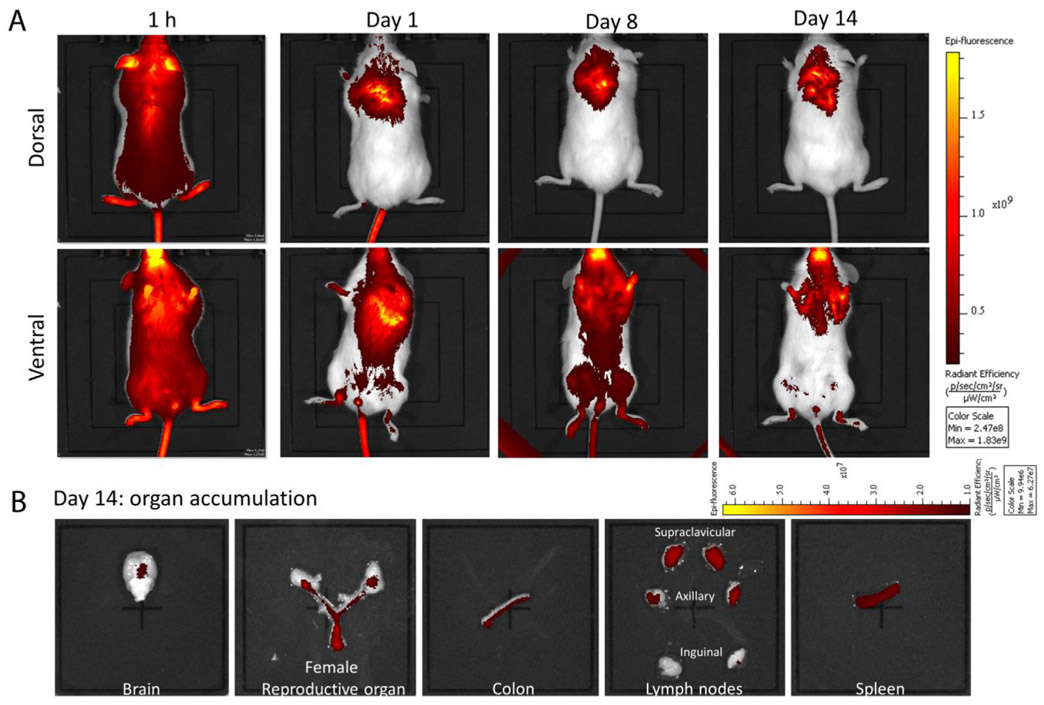
Fig. 1.
Bio-distribution and bio-accumulation study of IR NPs. A) Live animal images illustration bio-distribution profile of IR NP. Representative images of 1 h, day 1, 8 and 14 are shown. Upper panel represents ventral side of mice and the lower panel represents dorsal side of mice. B) Target organ accumulation profile of IR NP at end of experiment (day 14). The images are representative IR accumulation in brain, female reproductive tract, colon, lymph nodes, and spleen. All images were obtained with constant specifications i.e., excitation filter: 745 nm; emission filter: Open; fluorescent level: low (for time 1 h, 8 h and day 1) and high (for day 8 and 16); exposure time: 1 s. The entire image scale bar represents epi-fluorescence intensity as radiation intensity.

