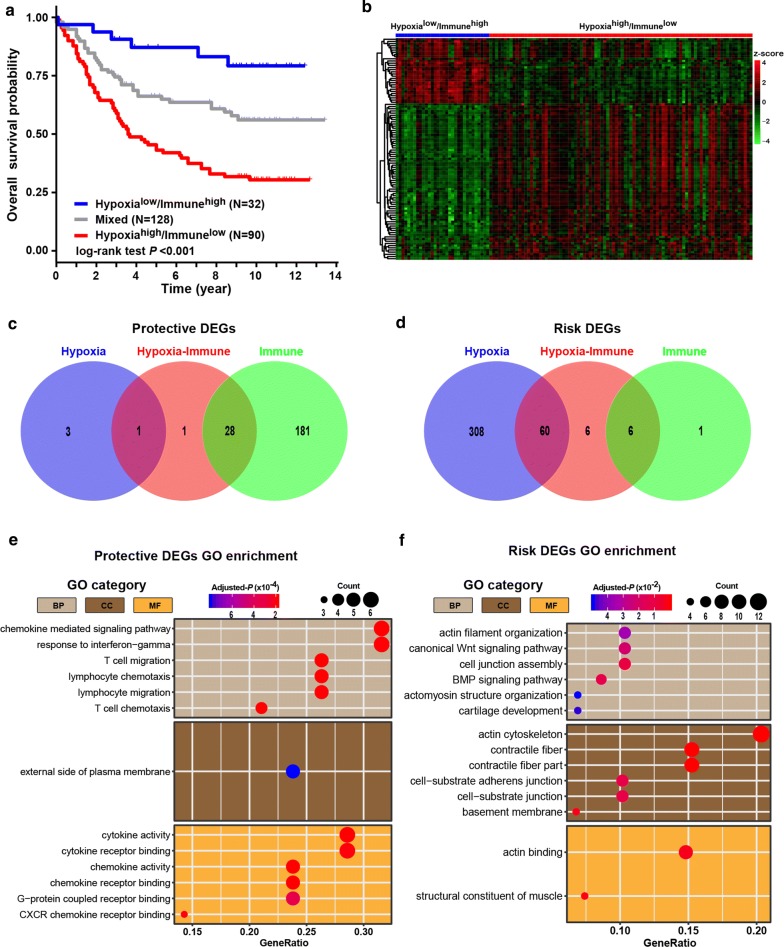
Fig. 2.
Identification and biological function of hypoxia-immune-related protective and risk DEGs. a Kaplan–Meier plot of overall survival for patients in three groups by combining the hypoxia and immune status. b Heatmap showing expression profiles for hypoxia-immune-related DEGs with comparison between hypoxialow/immunehigh and hypoxiahigh/immunelow groups. c, d Venn diagrams show overlaps of hypoxia-immune-related DEGs with hypoxia-related and immune-related DEGs for identification of protective and risk DEGs. e, f Representative Gene Ontology terms enriched by the hypoxia-immune-related protective and risk DEGs. P-values were adjusted by false discovery rate

