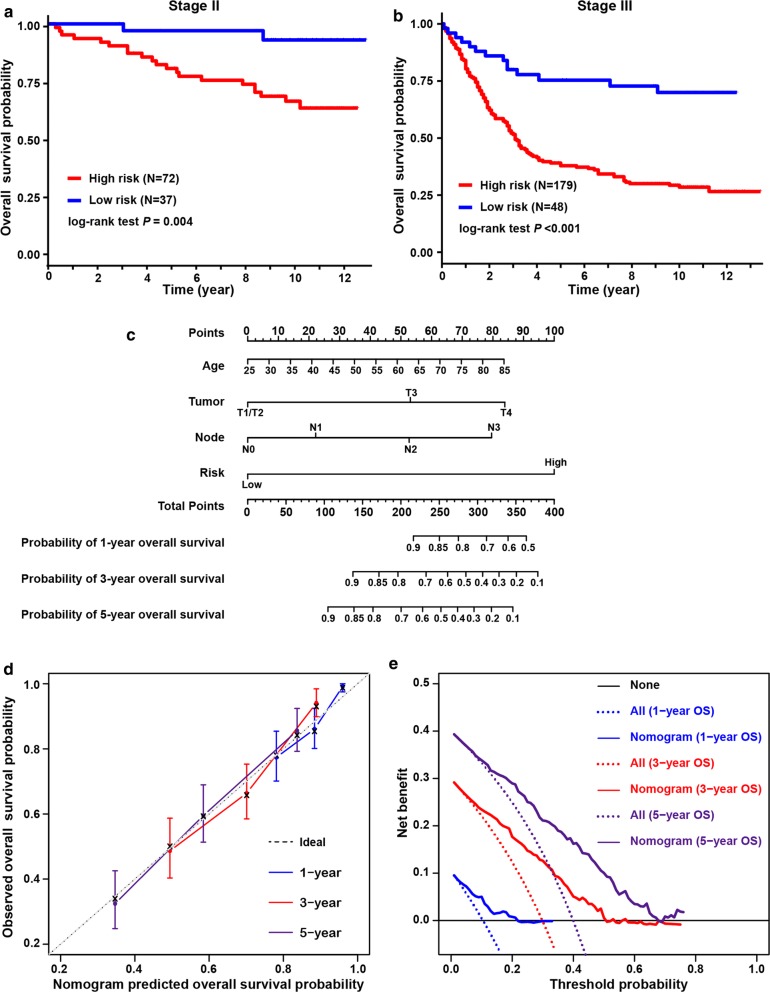
Fig. 4.
Validation of hypoxia-immune-based prognosis classifier in TNM subgroups and nomogram for predicting overall survival. a, b Kaplan–Meier plot of overall survival for patients in low-risk and high-risk groups by hypoxia-immune-based prognosis classifier in stage II and III subgroups in discovery cohort. c Nomogram developed by using discovery cohort to predict 1-, 3-, and 5-years overall survival probability. d Plot depicting the calibration of the nomogram in terms of the agreement between predicted and observed outcomes. Nomogram performance is shown by the plot relative to the dotted line, which represents perfect prediction. e Decision curve analysis shows the expected net benefits based on the nomogram prediction at different threshold probabilities. None: assume an event will occur in no patients (horizontal solid line); All: assume an event will occur in all patients (dash line)

