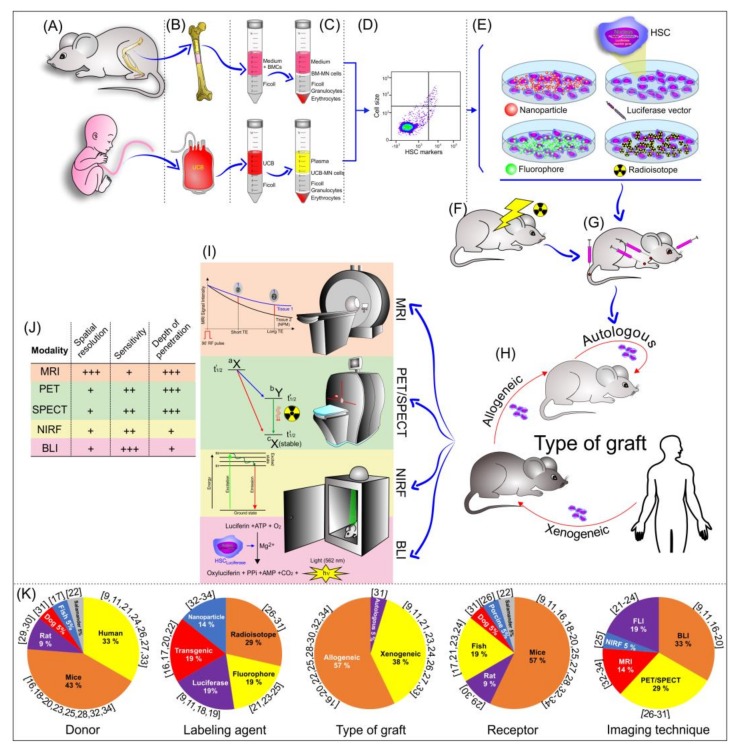
Figure 2.
Schematic illustration of the bone marrow transplantation process, from the isolation of HSCs to their implantation, and tracking evaluation by noninvasive imaging techniques. (A) Main cell donors; (B,C) main cell sources for HSC extraction; (D) HSC characterization after isolation; (E) contrast agent used in the HSC labeling; (F) animal pre-condition (irradiation) before HSC transplantation; (G) cell route used in the transplantation; (H) type of graft; (I) noninvasive imaging technique used in HSC tracking; (J) imaging modality features; and (K) the graphic of the percentual distribution of the main element analyzed in the systematic review.

