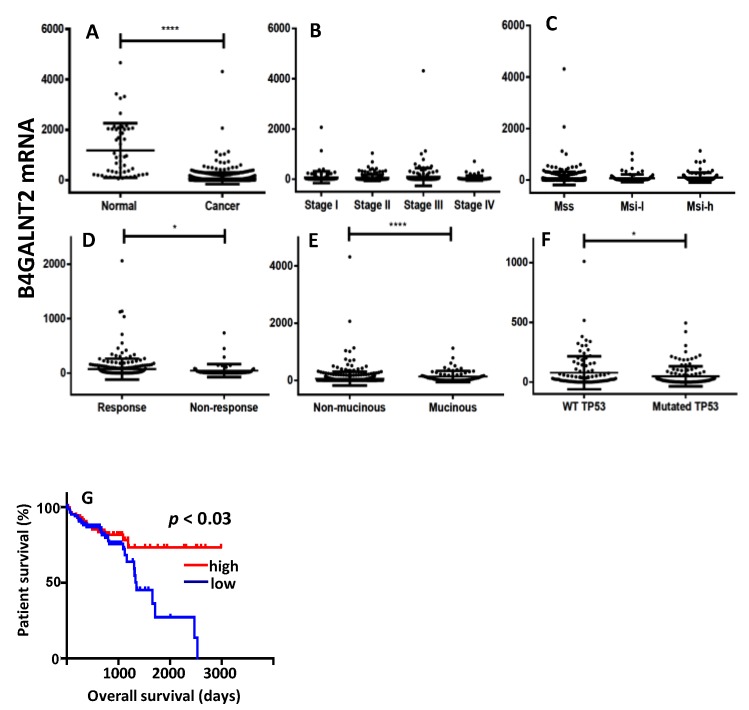
Figure 2.
The Cancer Genome Atlas (TCGA) data. (A) Expression level of B4GALNT2 mRNA in normal mucosa and colorectal cancer (CRC) specimens. (B–F) Expression of B4GALNT2 mRNA in CRC specimens grouped according to stage (B), microsatellite stability status (C), response to therapy (D) subtypes (E), and TP53 mutation (F). (G) Kaplan–Meier survival curves of patients grouped in the groups of high expressers (15th upper percentile, red) or no expressers (15th lower percentile, blu) of mRNA B4GALNT2 expression. MSS: microsatellite stable; MSI-l: microsatellite instable-low; MSI-h: microsatellite instable-high. * p ≤ 0.05; **** p ≤ 0.0001.

