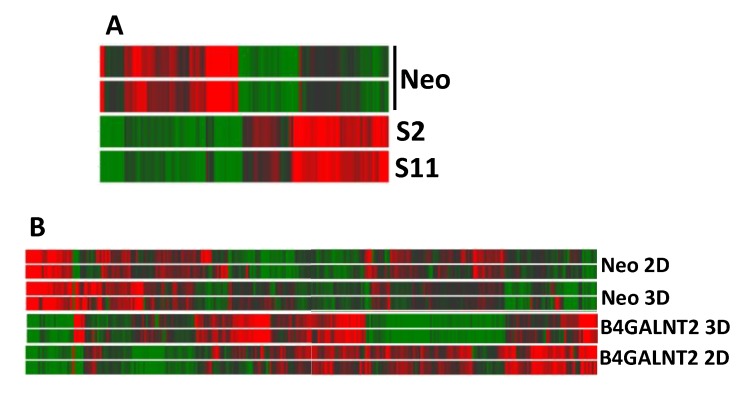
Figure 5.
Heatmaps of gene expression analysis. (A) B4GALNT2-expressing and control Neo LS174T cells grown in standard 2D conditions. (B) Cells grown in 3D conditions or in standard 2D conditions. High and low expression was normalized to the average expression across all samples. Differences were analyzed by the moderated t-test. Corrected p-value cut-off: 0.15; multiple test correction used: Benjamini–Hochberg.

