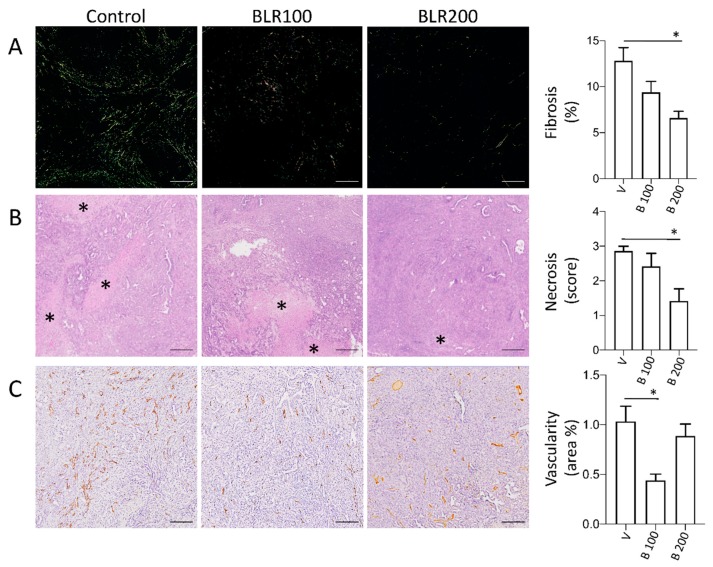
Figure 3.
Microenvironmental changes induced by BLR100 or BLR200 on PDAC tumors. Representative images and relative quantification of (A) fibrosis (polarized light microscopy analysis of Sirius red stained sections; scale bars, 25 µm), (B) necrosis (asterisks, H&E staining; scale bars, 200 µm) and (C) tumor vessels (CD31 IHC; scale bars, 200 µm) of control and peptide-treated FC1199 orthotopic tumors. N ≥ 6. One way ANOVA and Dunnett’s: * p < 0.05.

