Figure 1.
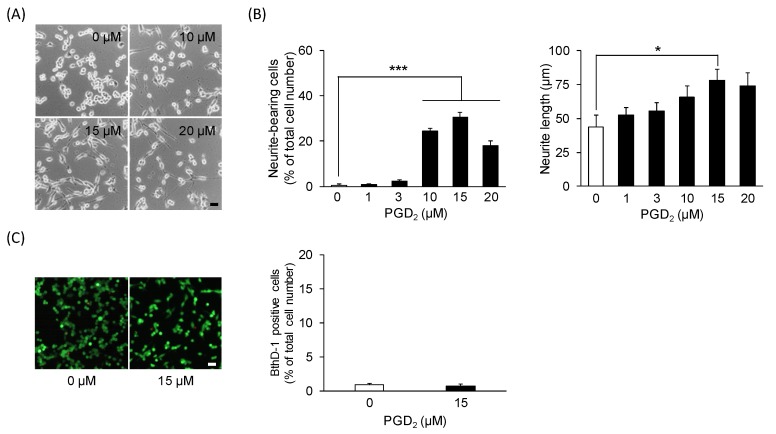
The effect of prostaglandin D2 (PGD2) on neurite outgrowth. Undifferentiated NSC-34 cells were exposed to various concentrations of PGD2 for 24 h. (A) Representative phase-contrast microscopy images of NSC-34 cells treated with various concentrations of PGD2. Scale bar: 50 μm. (B) The percentage of neurite-bearing cells (left panel) and the average neurite length (right panel) in each treatment group. Each value represents the mean ± SEM of four different experiments. * p < 0.05, *** p < 0.001. (C) Photographs show typical fluorescence images double staining of calcein-AM (green, live cells) and EthD-1 (red, dead cells) in each treatment group. Scale bar: 50 μm. Graphs show the percentage of EthD-1-positive dead cells in these cells. Each value represents the mean ± SEM of four different experiments.

