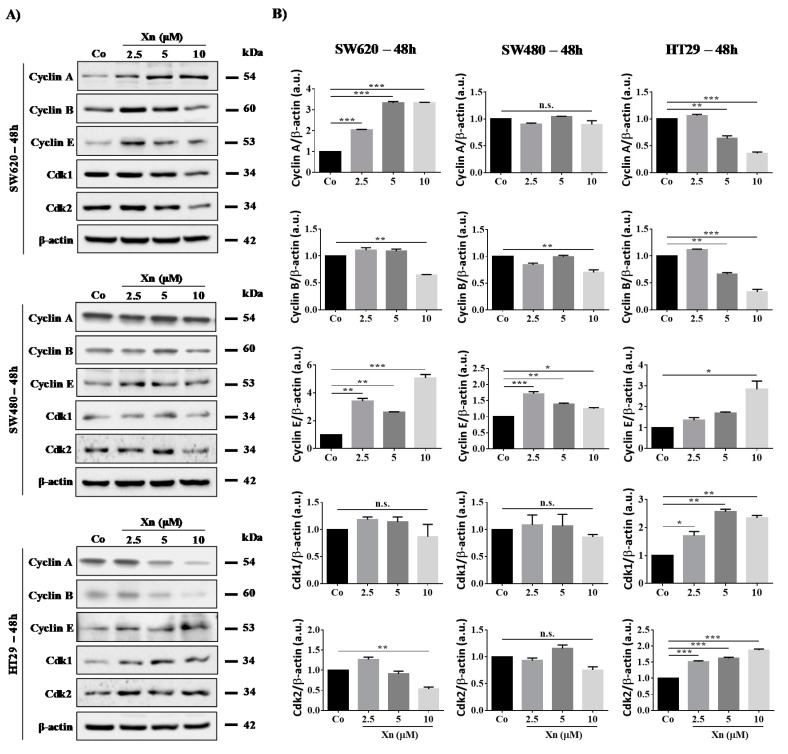
Figure 4.
Modulation of key cell cycle regulators after 48 h of treatment with xanthohumol (Xn) in colon cancer cell lines. (A) Immunoblot analysis of Cyclin A, B, E, Cdk1, and Cdk2 in Xn (2.5, 5, and 10 µM)-treated SW620, SW480, and HT29 cells for 48 h. β-actin: loading control. (B) Densitometry quantification of western blotting obtained in Figure 4A. Data are expressed as mean fold induction ± SEM of three independent experiments. p values were determined by a one-way ANOVA followed by Tukey’s multiple comparison test. * p < 0.05, ** p < 0.01, and *** p < 0.001.

