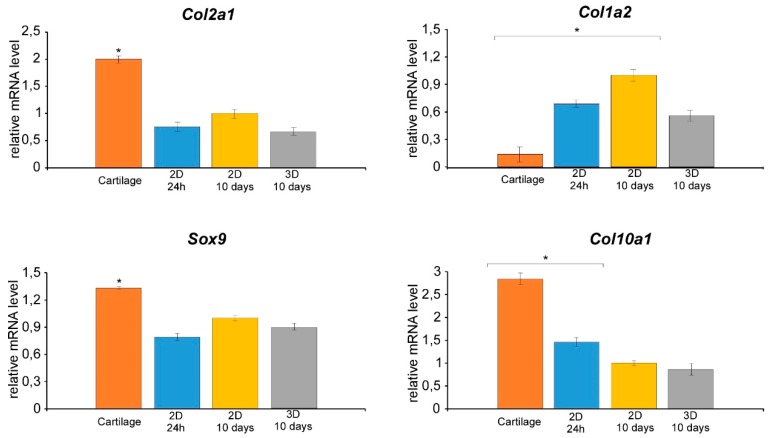
Figure 5.
Gene expression analyses of Sox9, Col II, I, and 10 by qRT-PCR. The gene expression levels were analyzed using the 2−ΔΔCt method using β-actin, 18S rRNA, and GAPDH as the internal controls. The data represent the mean ± SD of three independent culture experiments. Bars with different letters are significantly different from each other at P < 0.05.

