Figure 3.
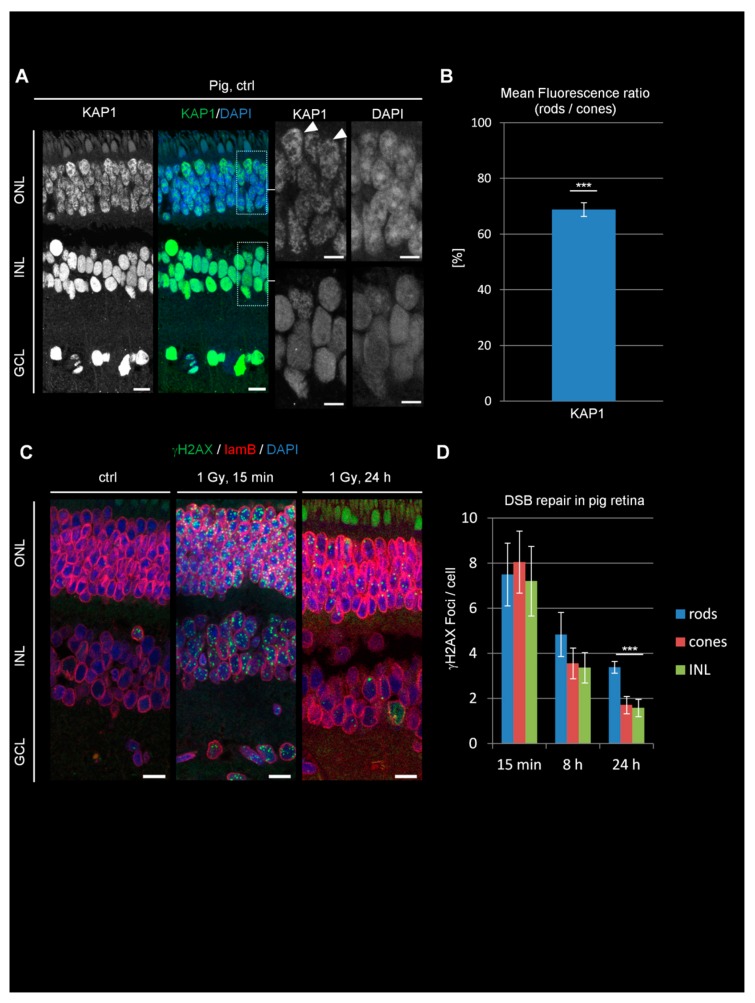
KAP1 expression and DSB repair in pig retinae. (A) Immunofluorescence images of KAP1 (green) in pig retinae. Nuclei were counterstained with DAPI (blue). Arrowheads in the enlarged pictures show cone PRs. Scale bars represent 10 μm in whole retina and 5 µm in enlarged pictures. (B) Quantification of the KAP1 signal in the nuclei of rods compared to cones. (C) Immunofluorescence images of radiation-induced γH2AX foci (green) and lamin B (red) in ctrl and irradiated pig retinae at 15 min and 24 h after 1 Gy. Nuclei were counterstained with DAPI (blue). Scale bars represent 15 μm. (D) Quantification of residual IR-induced γH2AX foci in rods, cones, and INL cells at 15 min, 8 h, and 24 h after 1 Gy irradiation. Data are presented as mean ± SEM from three experiments (n = 3). Control values are subtracted. p-values were obtained by t test and represent a comparison of all cells analyzed in the indicated cell population (at least 20 cells per data point and experiment for foci quantification and 10 nuclei for KAP1 fluorescence measurements in rods and cones) with ***: p < 0.001. ONL = outer nuclear layer, INL = inner nuclear layer, GCL = ganglion cell layer, lam B = lamin B.

