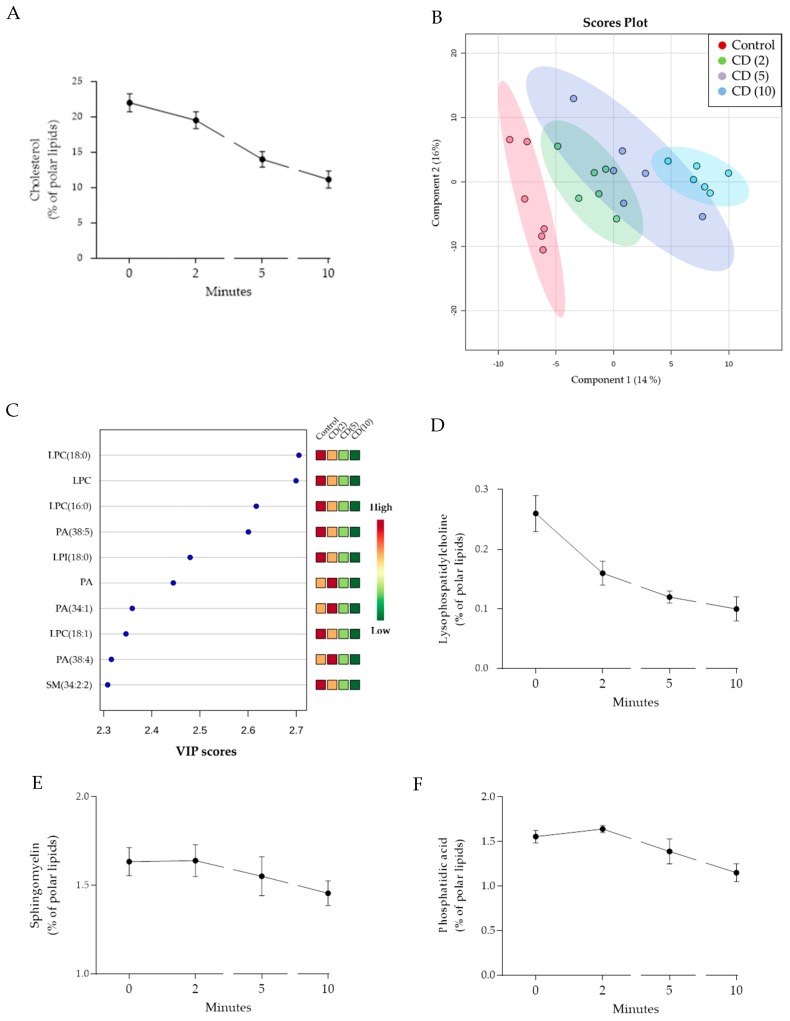
Figure 4.
Effect of MβCD on B16-F10 lipidome. (A) Time-dependent changes in the levels of cholesterol; (B) PLS-DA scores plot generated without cholesterol values; (C) Most important discriminative features due to MβCD treatment: lysophosphatidylcholine (LPC), phosphatidic acid (PA), lysophosphatidylinositol (LPI), sphingomyelin (SM); Time-dependent changes in the levels of lysophosphatidylcholine (D), sphingomyelin (E), and phosphatidic acid (F). CD (X): cells exposed for 2, 5, or 10 min to MβCD.

