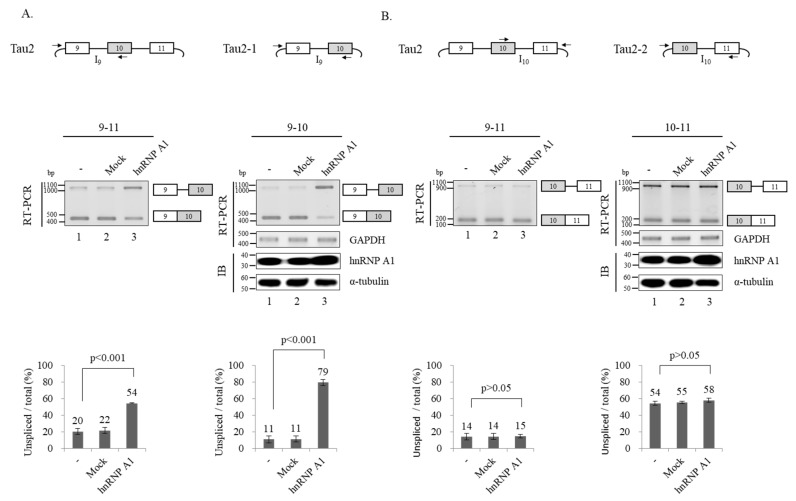
Figure 3.
hnRNP A1 inhibits splicing of intron 9 but not intron 10. (A) (Upper panel) Schematic of Tau2 and Tau2–1 minigenes are shown. Primers used for RT-PCR are shown with arrows. (Middle panel) RT-PCR monitoring intron 9 splicing in Tau2 and Tau2–1 minigenes in hnRNP A1 or pcDNA transfected cells. Immunoblotting analysis of hnRNP A1 and α-tubulin in Tau-2–1 minigene splicing are shown. Immunoblotting in Tau2 minigene is shown in Figure 2B. (Lower panel) Bar charts of RT-PCR results are shown. (B) (Upper panel) Schematics of Tau2 and Tau2–2 minigenes are shown. Primers used for RT-PCR are shown with arrows. (Middle panel) RT-PCR monitoring intron 10 splicing in Tau2 and Tau2-1 minigenes in hnRNP A1 or pcDNA transfected cells. Immunoblotting analysis of hnRNP A1 and α-tubulin in Tau-2–2 minigene splicing are shown. Immunoblotting in Tau2 minigene is shown in Figure 2B. (Lower panel). Bar charts of RT-PCR results are shown.

