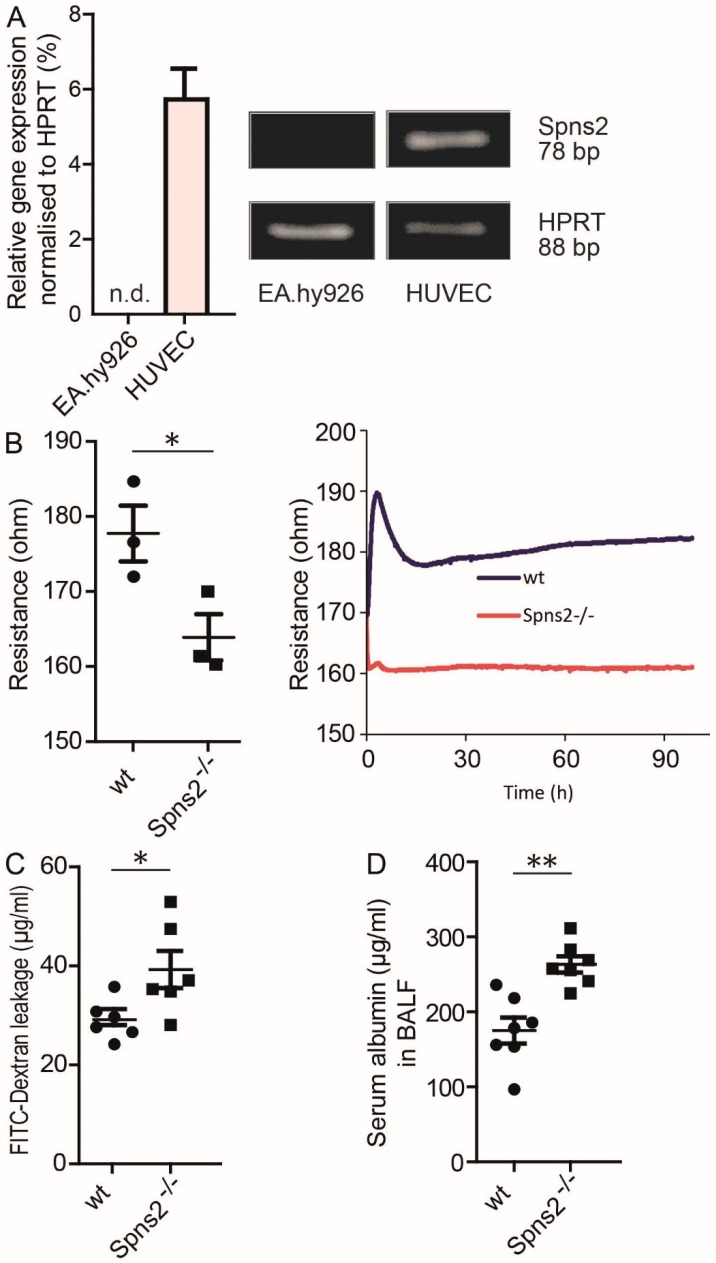
Figure 4.
Role of Spns2 for EC barrier stability. (A) qPCR analysis of Spns2 in EA.hy926 and HUVEC, n = 3, means ± SEM. Images show representative agarose gel electrophoresis signals of amplified PCR products for HPRT and Spns2. (B) Difference in initial non-stimulated resistance of primary lung ECs isolated from wt and Spns2 deficient mice in ECIS measurements, means ± SEM, n = 3, * p < 0.05, determined by two-sided Student’s t-test. Single values represent the resistance values for separate mice taken 90 h after seeding. Line plot represents one experiment out of three. (C) FITC-dextran leakage assay with primary lung endothelial cells isolated from wt and Spns2 deficient mice, means ± SEM, n = 6, * p < 0.05, determined by two-sided Student’s t-test. (D) Serum albumin measurement in BALF isolated from wt and Spns2 deficient mice, means ± SEM, n = 6, ** p < 0.01, determined by a two-sided Student’s t-test.

