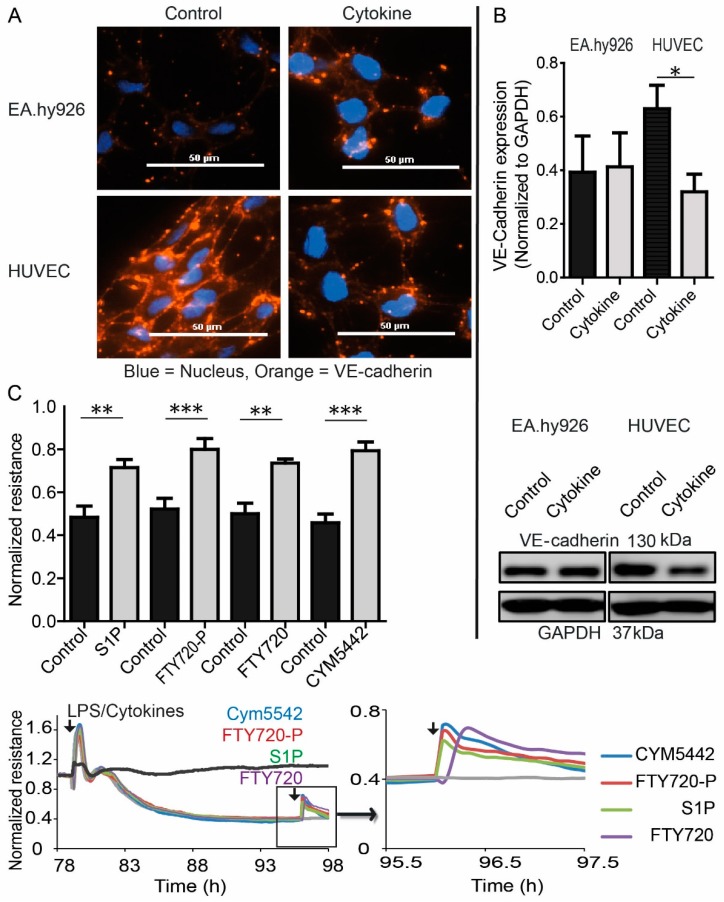
Figure 6.
Role of S1P and S1PRs in EC barrier destabilization induced by LPS and cytokines. (A) Immunofluorescence staining of VE-cadherin and Western blot analysis of VE-cadherin and GAPDH in EA.hy926 and HUVEC after stimulation with LPS and cytokines or vehicle. Representative images from one out of three individual experiments are shown, size bar = 50 µm. (B) Western blot quantification (top) and representative Western blot (bottom) of VE-cadherin expression in EA.hy926 and HUVEC after stimulation with LPS and cytokines or vehicle, means ± SEM, n = 3, * p < 0.05, determined by two-sided Student’s t-test. (C) Resistance following treatment with a mix of LPS and cytokines (50 ng/mL IL1β, 50 ng/mL TNFα, 1 µg/mL LPS), and re-stimulated with 1 µM of the S1PR1 agonist CYM5442, 1 µM of the S1PR1,3,4,5 agonist FTY720-phosphate and its non-phosphorylated precursor FTY720, and 1 µM S1P. Line plots represent one experiment out of three with black arrows indicating the addition of stimuli at the corresponding time points. The dark grey line represents an unstimulated control, the light grey line represents a control stimulated with LPS and cytokines without second stimulation. Bar graph represents means ± SEM, n = 3, ** p < 0.01, *** p < 0.001, determined by two-sided Student’s t-test. Normalized resistance values were taken before (controls) and after treatment with S1P, FTY720-P, FTY720, and CYM5442 at the time of the established maximal change of resistance of cells divided by resistance of cells before LPS/cytokine treatment.

