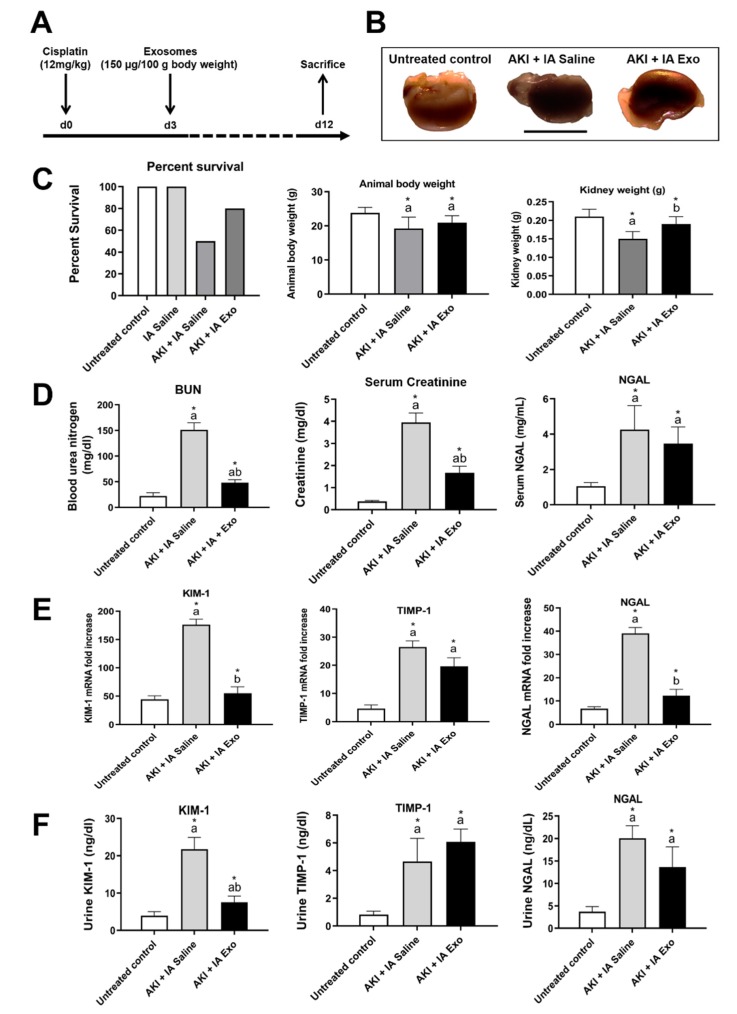
Figure 2.
Physiological and molecular markers of kidney injury. (A) Study protocol. (B) Gross appearance of kidney. (C) Percent survival, animal body weight, and kidney weight. (D) Serum concentration of blood urea nitrogen (BUN), creatinine, and NGAL, as measured by serum ELISA. (E) mRNA expression of KIM-1, TIMP-1, and NGAL in kidney lysates, as measured by qRT-PCR. (F) Urine concentrations of KIM-1, TIMP-1, and NGAL, as measured by urine ELISA. Measurements were taken at day 12. Each group has n = 8 mice, except for survival data for which n = 10 for untreated controls and n = 20 mice for other groups. Significant difference a p < 0.05: relative to untreated control group; b p < 0.05: relative to AKI + IA saline group.

