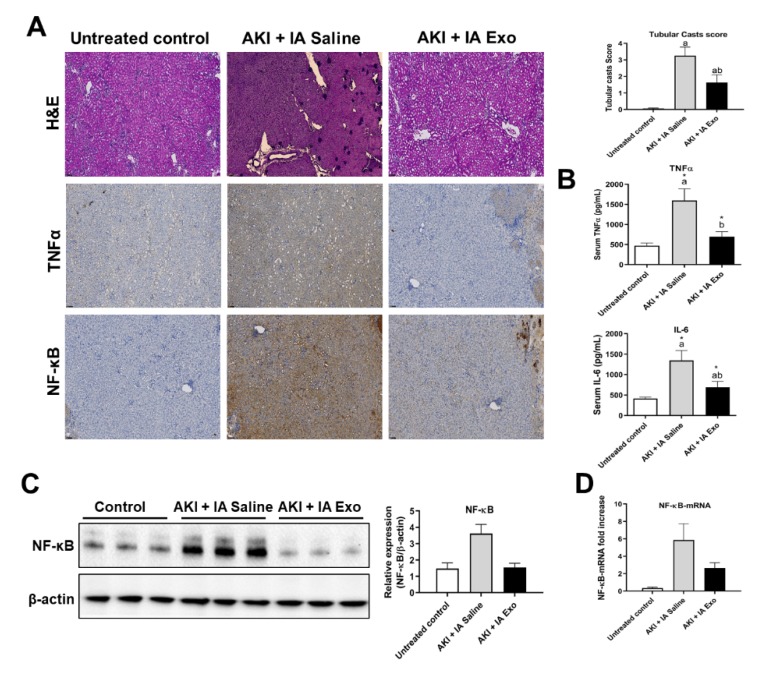
Figure 3.
Inflammatory cytokines. (A) Hematoxylin and eosin (H&E) staining and immunohistochemistry (IHC) of kidney tissue, stained for TNF-α and NF-κB, and quantification of tubular casts. (B) Serum concentrations of TNF-α and IL-6, as measured by serum ELISA. (C) Western blot and quantification of NF-κB and β-actin from kidney lysate. (D) mRNA expression of NF-κB, as measured by qRT-PCR. Measurements were taken at day 12. Each group has n = 5 mice for TNF-α and IL-6 measurements and n = 3 mice for NF-κB measurements. Significant difference a p < 0.05: relative to untreated control group; b p < 0.05: relative to AKI + IA saline group.

