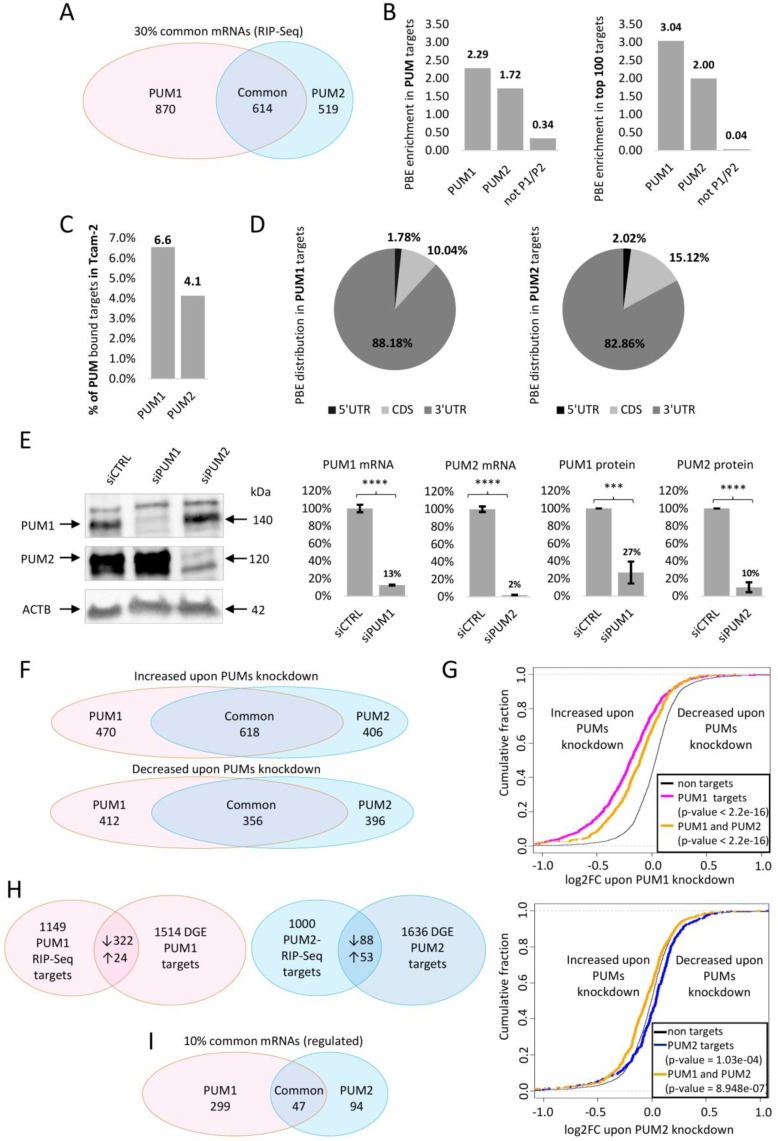
Figure 1.
Identification of PUM1- and PUM2-regulated mRNA targets. (A) Venn diagram showing the numbers of PUM1-specific, PUM2-specific, and PUM1/PUM2 common mRNA targets from RIP-Seq. (B) PUM-binding element (PBE) enrichment in total PUM1- or PUM2-bound mRNAs (left panel) compared to PBE enrichment in the top 100 mRNAs bound to PUM1 or PUM2 (right panel) calculated by using FIMO software, p < 0.0001. (C) % representation of PUM1- or PUM2-bound mRNAs within the whole TCam-2 mRNA transcriptome. (D) Diagrams representing PBE motif distribution within the 5′UTR, CDS, or 3′UTR of PUM1 (left) or PUM2 (right) bound mRNA targets (FIMO analysis with p < 0.0001). (E) Representative WB showing efficiency of PUM1 and PUM2 siRNA knockdown (left panel) and histograms showing quantitation of mRNA (middle panel) and protein (right panel) knockdown effect from three biological replicates. For quantitative analyses, ACTB was used as a reference for protein analyses; ACTB and GAPDH for mRNA RT-qPCR analyses *** p < 0.0005; **** p < 0.00005. (F) Analysis of mRNAs whose expression was significantly changed upon PUM1 or PUM2 siRNA knockdown. Venn diagram representing the numbers of mRNAs repressed (upper graph) or activated/stabilized (lower graph) by PUM1, PUM2, or both. The Venn diagram represents the number of mRNAs increased (upper graph) or decreased (lower graph) upon siRNA knockdown of PUM1 (pink), PUM2 (blue) or both. (G) Cumulative distribution plots of log2FC (fold changes) of all mRNA expression level upon PUM knockdown of targets identified in RIP-Seq PUM1 (upper panel) and PUM2 (lower panel). Changes on the left of the black curve “non targets” control indicate that the targets were repressed, while those on the right of the black curve indicate that the targets were stabilized/activated. (H) Venn diagrams showing mRNAs regulated by PUM proteins (as identified by both the RIP-Seq approach and DGE of RNA-Seq upon PUMs knockdown approach); PUM1-regulated (upper panel), PUM2-regulated (lower panel). ↑ activated, ↓ repressed mRNAs (I) Venn diagram representing the numbers of mRNAs regulated by PUM1, PUM2, or commonly regulated based on data presented in H.

