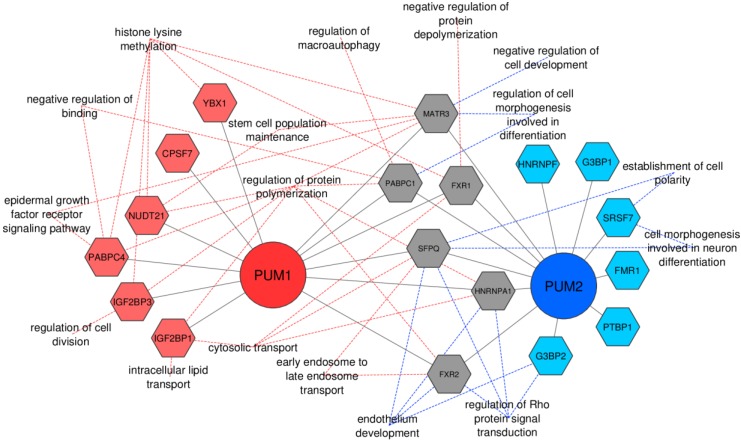
Figure 4.
Model of PUM1 and PUM2 RNA regulons in TCam-2 cells. PUM1 and PUM2 are represented by red and blue circles, respectively, while PUM1-, PUM2-, and PUM1/PUM2-interacting RBPs are represented by red, blue, or grey diamonds, respectively. Continuous lines represent interactions of PUM1 and PUM2 with putative RBP cofactors. Dashed lines represent functions (biological processes from ClueGOanalysis) of groups of mRNAs regulated by PUM1 (dashed red lines) and PUM2 (dashed blue lines) with high enrichment (above threshold) of binding motifs for particular RBPs in mRNAs regulated by PUM1 or PUM2.

