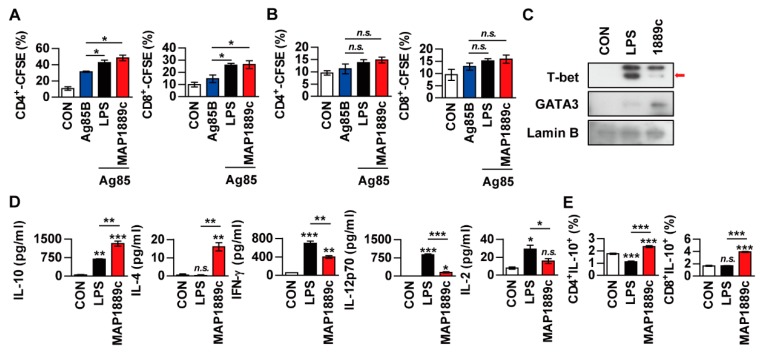
Figure 6.
MAP1889c-activated BMDCs induce T cell proliferation and a Th2 response. (A,B) BMDCs from C57BL/c were activated with MAP1889c (10 ug/mL) or LPS- (100 ng/mL), pulsed with Ag85B (10 ug/mL) for 24 h, and then co-cultured with carboxyfluorescein succinimidyl ester (CFSE)-stained splenocytes isolated from Ag85B-immunized BALB/c (A) or C57BL/6 (B) mice for 72 h. The proliferation of CD4+ and CD8+ T cells was then assessed by flow cytometry. CON, T cells co-cultured with untreated DCs. (C–E) Unstimulated, LPS-stimulated, and MAP1889c-stimulated DCs were co-cultured with naïve splenocytes of C57BL/6 mice at a DC to splenocyte ratio of 1:10. After 72 h, the levels of T-bet and GATA-3 expression in the T cells were assessed by immunoblotting (C). The cytokine levels in the culture supernatants were measured by ELISA (D). Subsequently, IL-10-producing CD4+ T cells (CD4+IL-10+) and IL-10-producing CD8+ T cells (CD8+IL-10+) were gated as shown (E). Gating strategies are shown in Figure S2. All data are expressed as the mean ± SD (n = 3). * p < 0.05, ** p < 0.01, and *** p < 0.001 for the treatment compared with untreated controls (CON) or for the difference between treatment data. n.s., no significant difference.

