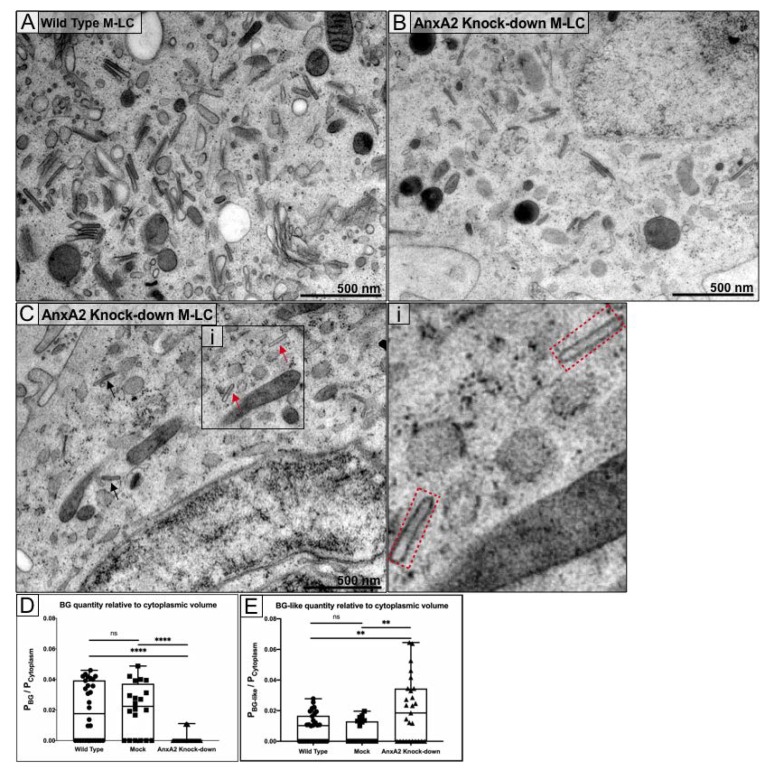
Figure 4.
BG formation is significantly reduced in the absence of A2t. Wild type M-LC (A) contain an abundance of cytoplasmic BG as compared with A2t knockdown M-LC (B). At the same magnification, the relative abundance of cytoplasmic BGin WT and A2t knockdown M-LC is compared; (C) BG-like structures (red arrows) were observed in anxA2 knockdown M-LC and the missing striation through the center of the CMS is visualized (red box, insert i); (D,E) Stereology was used to analyze images for BG/BG-like quantification in wild type, mock-infected, and anxA2 knockdown M-LC. A 1 μm grid was overlaid to quantify cytoplasmic volume (Pcytoplasm) and BG abundance (PBG). Each point represents a single cell. Box and whisker plots show minimum, 1st quartile, median, 3rd quartile, and maximum values for each of the groups. ** p < 0.01, **** p < 0.0001, one-way ANOVA followed by Tukey’s multiple comparisons test. Data are representative of two biological replicates.

