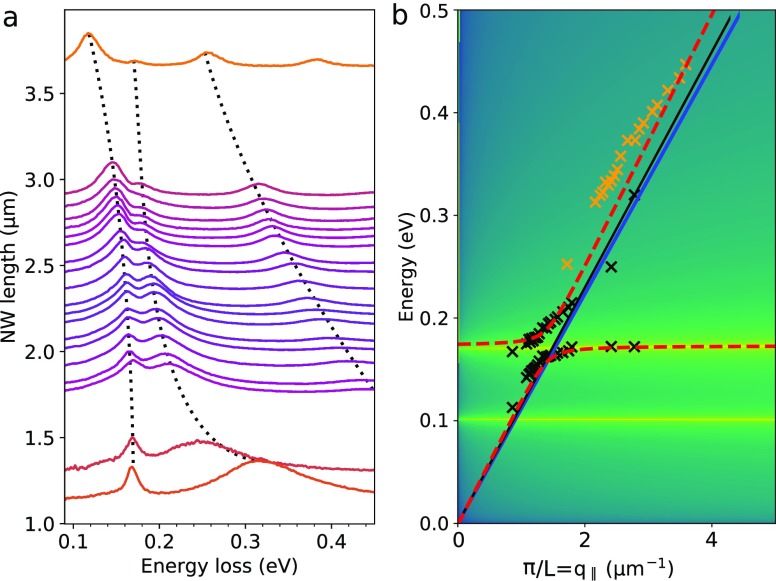
Figure 2.
Plasmon–phonon strong coupling. (a) EELS spectra measured at the tip in vacuum of a metallic nanowire (under sample configuration (1) in Figure 1a) as a function of nanowire length. By changing through milling the length of the nanowire, its dipolar plasmon mode is brought in and out of strong coupling with the h-BN phonon modes at around 180 meV. The strong coupling is confirmed by the anticrossing of the two modes, indicated by the two dashed curves (added as guides to the eye) on the left of (a). (b) Theoretical calculations for the energies of the coupled modes (dashed-red curve) and the energy position measured in experiments (black and orange crosses for the dipolar and quadrupolar modes, respectively).27−29 The light line is marked in blue.

