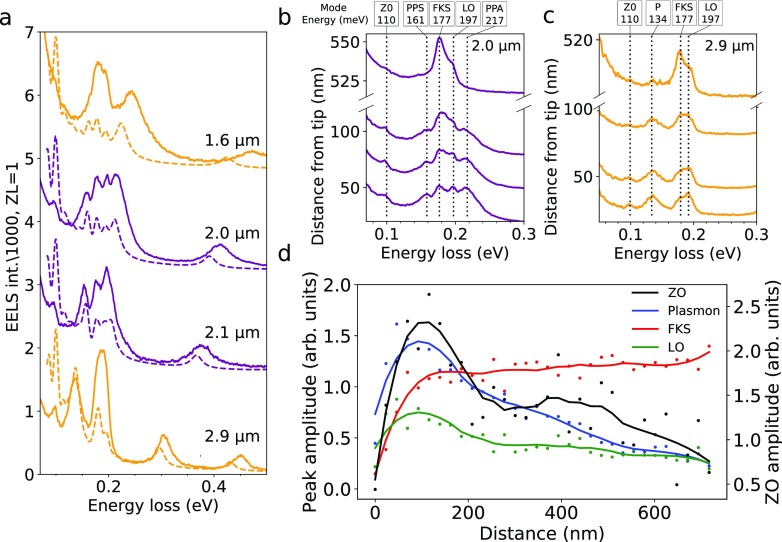
Figure 3.
Plasmon-enhanced phonon losses. (a) Experimental (full curves) and calculated (dashed curves) EELS spectra at one of the tips of a metallic nanowire fully supported on h-BN (configuration (2) in Figure 1a) for different lengths of the nanowire: 1.6, 2.0, 2.1, and 2.9 μm. When the dipolar plasmon mode is close to or on resonance with h-BN phonon modes, the latter are enhanced, leading to the appearance of multiple peaks. (b,c) Spectra as a function of distance from the nanowire tip for lengths 2.0 μm (b) and 2.9 μm (c). The ZO, PPS, FKS, LO, PPA, and uncoupled plasmon (P) modes are labeled as described in the main text. (d) Peak intensities retrieved from fits to spectra at different distances from the nanowire tip (data shown in SI Figure 13).

