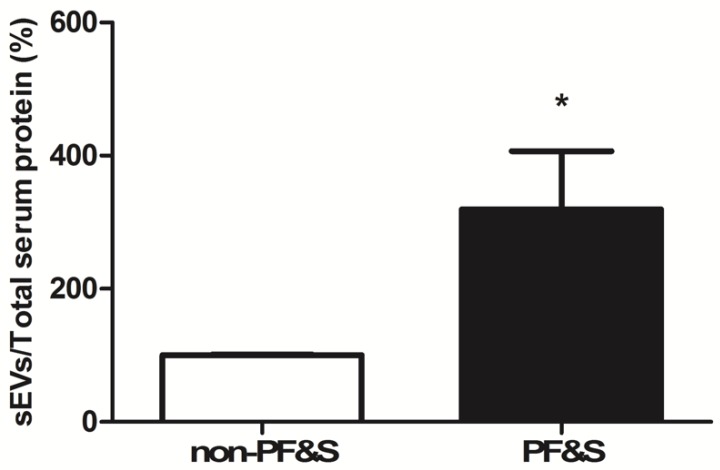
Figure 2.
Serum levels of small extracellular vesicles (sEVs) in non-physically frail non-sarcopenic (non-PF&S) controls (n = 10) and participants with physical frailty and sarcopenia (PF&S; n = 11). Data were normalized for the amount of total serum proteins and are shown as percentage of the control group set at 100%. Bars represent mean values (±standard error of the mean). * p < 0.05 versus non-PF&S.

