Figure 3.
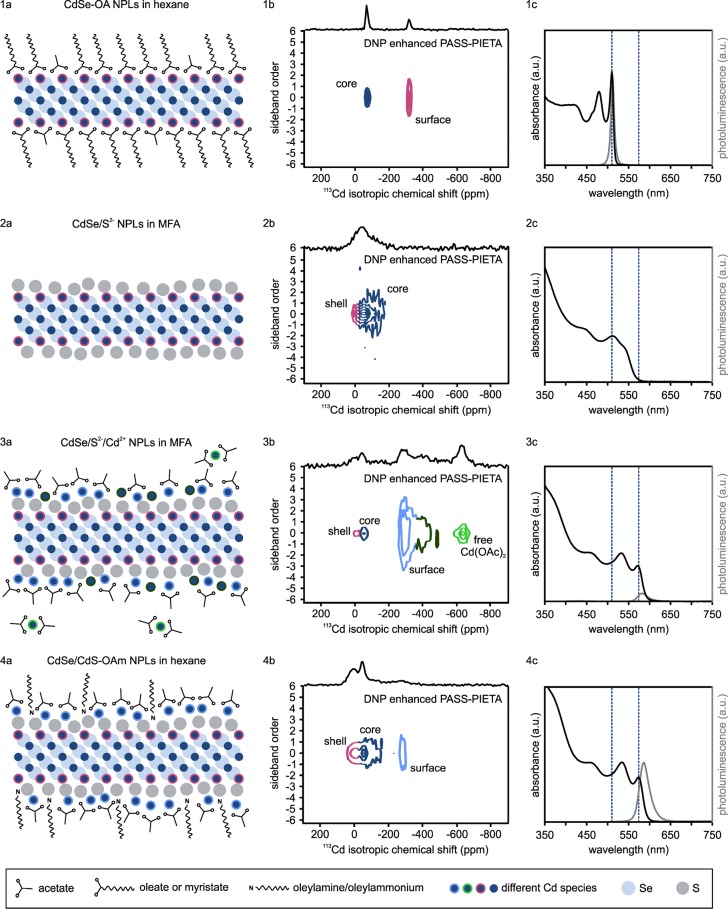
(1a–4a) Schemes of the different steps of the c-ALD growth of one CdS monolayer onto CdSe NPLs, along with the corresponding DNP enhanced PASS–PIETA spectra (1b–4b) and optical absorption (black lines) and emission (gray lines) spectra (1c–4c). The color coding of the cadmium atoms in the schemes indicates to which signal they belong to in the corresponding DNP enhanced PASS–PIETA spectrum. The dashed lines in the absorption spectra serve as a guide to the eye by indicating the initial and final excitonic peak position. Panel 1b presents the same data as in Figure 1c.

