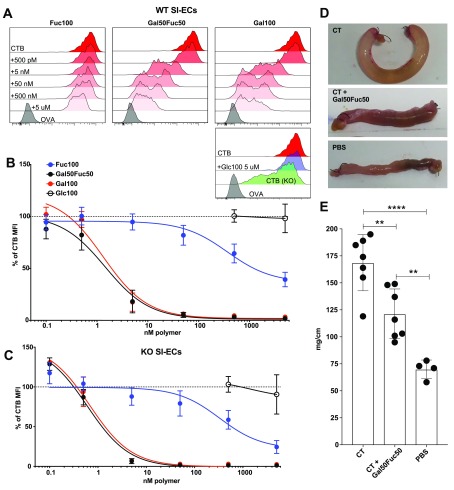
Figure 2.
Evaluation of glycopolymers’ capacity to block CTB binding to murine SI enterocytes and intoxication. (A–C) Cells were isolated from murine SI, stained for common cell markers and with CTB to analyze the polymer block by flow cytometry. Full gating can be seen in Figure S4. Panel (A) shows representative histograms of CTB binding to WT EpCAM+ cells with or without the polymer block. Panels (B) and (C) show graphs of gMFI for CTB binding after the polymer block. The values are normalized to the % of unblocked CTB gMFI. Data is pooled from three independent experiments with two to three mice in each experiment, and error bars represent the SD. (D) Representative pictures of ligated loops after 4 h of CT (10 μg/mL) treatment with or without Gal50Fuc50 polymer (40 μM) or just PBS in vivo. (E) Bar graph showing fluid accumulation as the length/weight ratio of the ligated loops. In each animal, two loops were created. Statistics were calculated using one-way ANOVA with Tukey correction. Two stars represent p < 0.01, and four stars represent p < 0.001. Error bars represent the SD, and each dot represents a loop.

