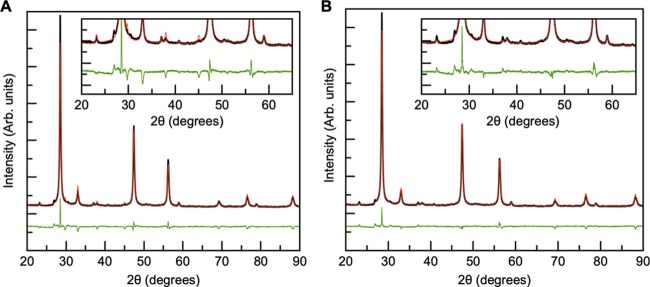
Figure 9.
Rietveld refinement of the as-synthesized sample C. (A) Refinement with the CZTS kesterite phase. (B) Two-phase refinement with the kesterite and sphalerite phases. In all fits, the data are shown in black, the model in red, and the difference between the two in green. The insets show a magnification of the difference curve.

