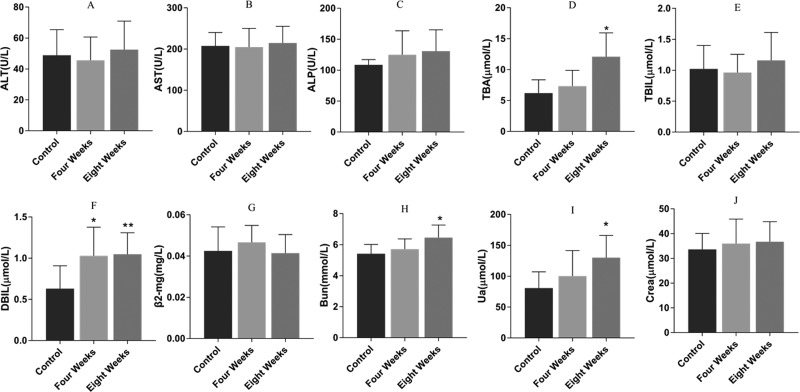
Figure 1.
Serum levels of ALT (A), AST (B), ALP (C), TBA (D), TBIL (E), DBIL (F), β2-MG (G), BUN (H), UA (I), and Crea (J) (n = 10). Data were expressed as the mean ± standard deviation (SD) and were analyzed by analysis of variance (ANOVA). *p < 0.05 vs control group; **p < 0.01 vs control group. (A)–(F) Index of the liver and (G)–(J) index of the kidney.

