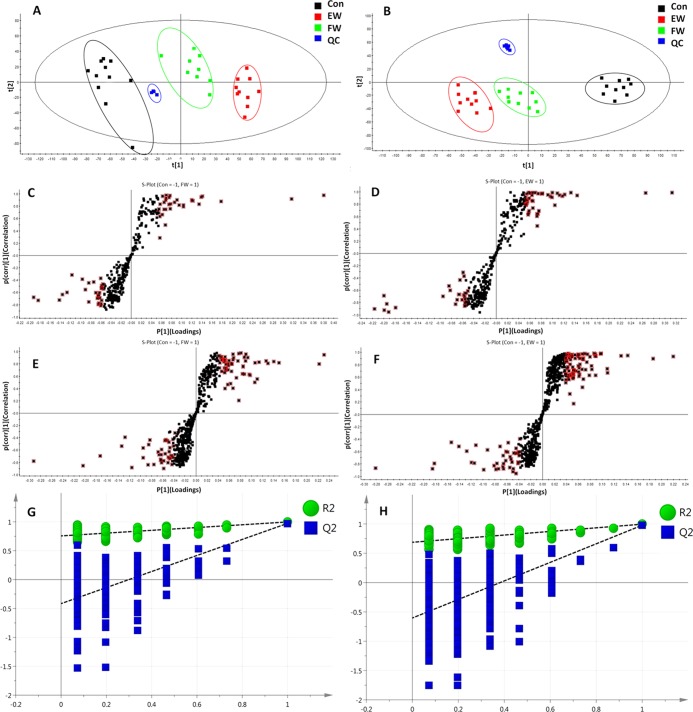
Figure 3.
PCA and orthogonal projections to latent structures discriminant analysis (OPLS-DA) plots of PM groups in ESI+ and ESI– modes, respectively. PCA plots of control and PM groups in ESI+ (A) and ESI– (B) modes. S-plot of OPLS-DA for control group versus PM groups (I and II) in ESI+ (C, D) and ESI– (E, F) modes. Metabolites with variables with importance parameter (VIP) >1 were marked with a red square in ESI+ (C, D) and ESI– (E, F). Cross-validated score plots (G, H) (n = 10).

