Fig. 2.
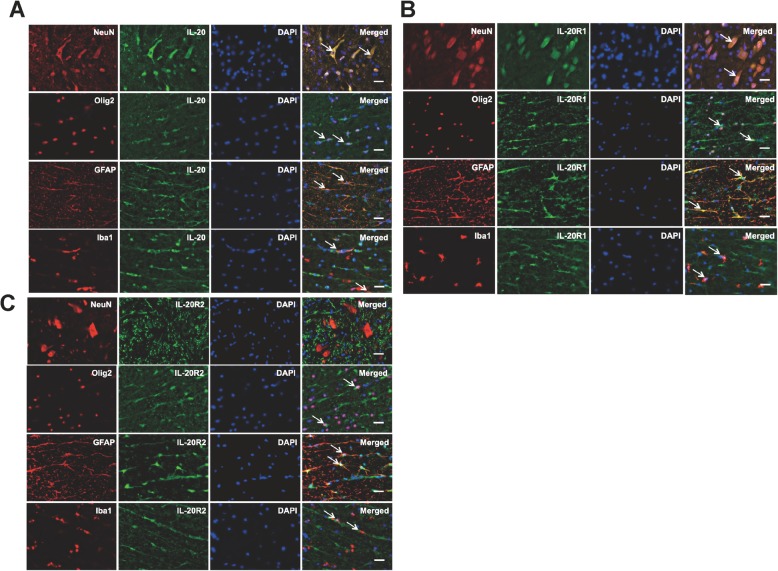
Expression of IL-20, IL-20R1, and IL-20R2 in spinal cord tissues after SCI. The transverse sections around the interface between gray and white matters of the spinal cord obtained from SCI rats (N = 5). a Double immunofluorescence staining of IL-20 (green) with markers for specific neural cell types (red) including NeuN (neurons), Olig2 (oligodendrocytes), GFAP (astrocytes), and Iba1 (microglia). Nuclei were counterstained with DAPI (blue). Co-localization of IL-20 with each cellular marker appears yellow in the merged image. Scale bars = 500 μm. b, c Double immunofluorescence staining of IL-20R1 (green) or IL-20R2 (green) with markers for specific neural cell types (red) as described above. Co-localization of IL-20R1 or IL-20R2 with each cellular marker appears yellow in the merged image. Scale bars = 500 μm. NeuN, neuronal nuclei; Olig2, oligodendrocyte transcription factor 2; GFAP, glial fibrillary acidic protein; Iba1, ionized calcium-binding adapter molecule 1. Data from one representative experiment of three independent experiments is shown

