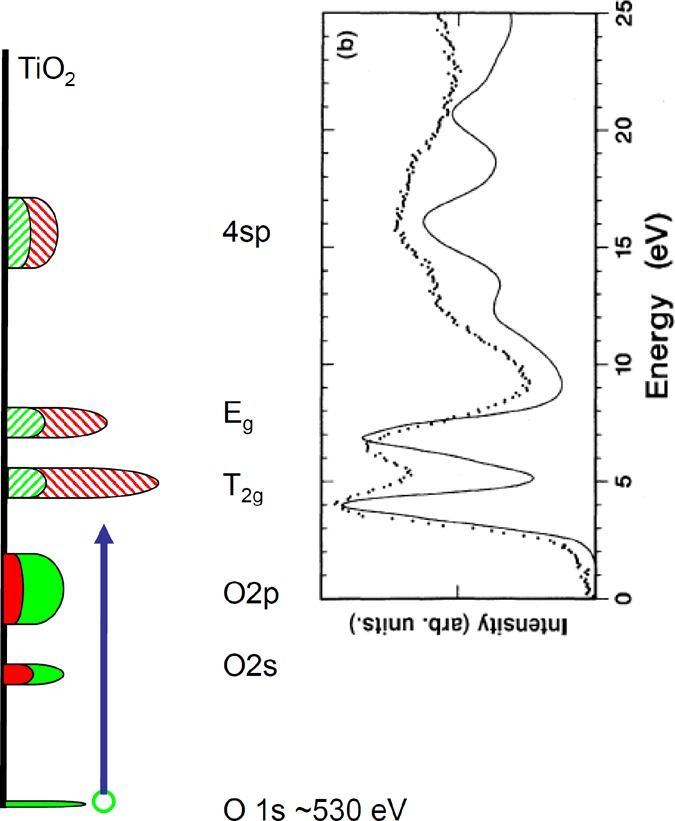
Figure 31.

Interpretation of the oxygen K-edge XAS spectrum of a 3d transition metal oxide. The oxygen 1s core state is given in green at 530 eV binding energy. The occupied oxygen 2s and 2p bands are given as a combination of oxygen (green) and metal (red). The empty states are given with striped colors: The ratio of t2g and eg states is 6:4, but the oxygen contribution (in green) is equivalent. At higher energy, the metal 4sp band is given. The experimental spectrum of TiO2 is given as example.
