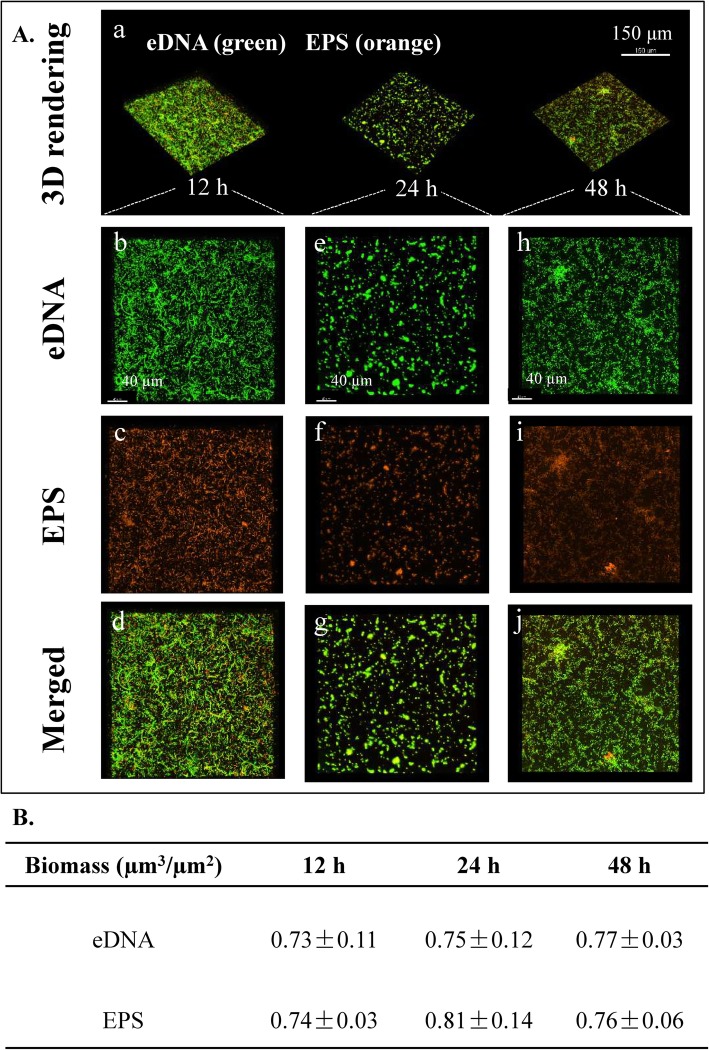
Fig. 6.
Structural arrangement between exopolysaccharide (EPS) and extracellular DNA (eDNA) during biofilm development of EPS mutant (∆epsG). A Representative 3D renderings of B. subtilis SBE1 biofilms at 12, 24 and 48 h: (a) shows the dynamic evolution of biofilms over time. Panel (b-J) show cross sectional images of selected area for close-up views of structural organization of EPS (orange) and eDNA (green) during the development of biofilm matrix complex. B The biomass values of EPS and eDNA in the biofilms were calculated using Imaris. The data shown are mean values ± SD (n = 3)

