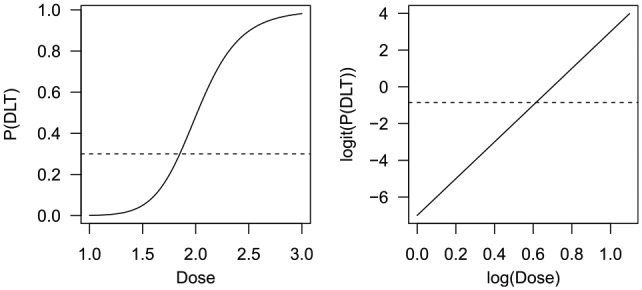
Figure 1.

Example of an S-shaped dose-toxicity curve (left) and the corresponding straight line after transformation (right). The dotted horizontal line indates a target toxicity level of 0.3, or log(0.3/0.7) = –0.847 on the logit scale. P(DLT): probability of a dose-limiting toxicity.
