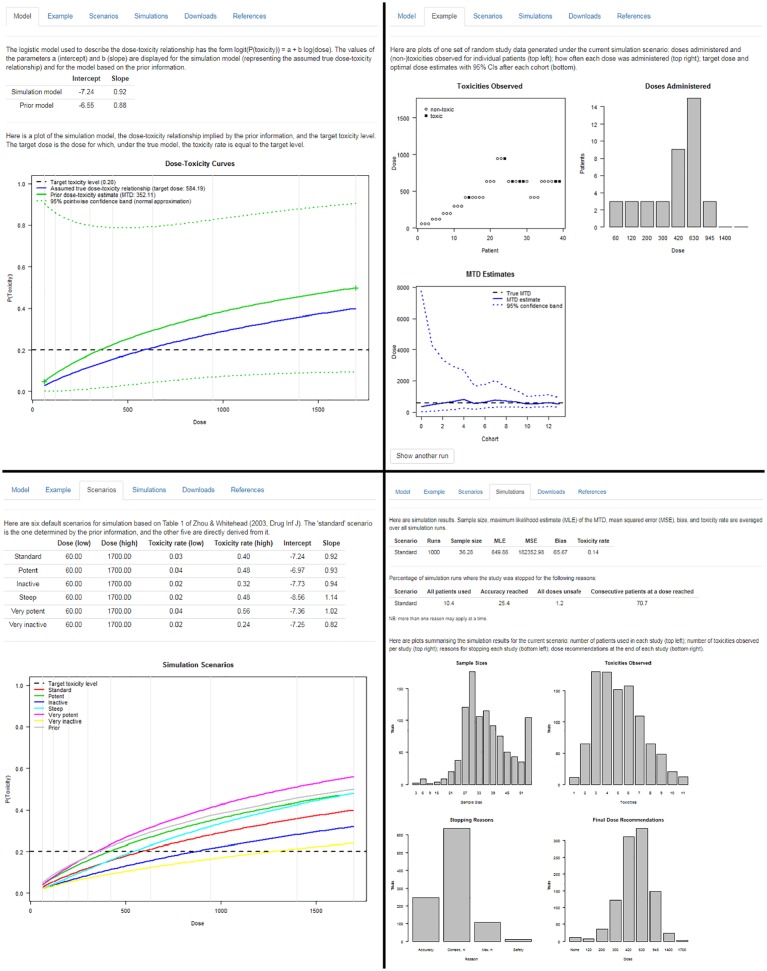
Figure 4.
Top left: ‘Model’ tab of the ‘Design’ module displaying the prior and the assumed true dose-toxicity curve. Top right: ‘Example’ tab of the ‘Design’ module showing one simulated example dataset. Bottom left: ‘Scenarios’ tab of the ‘Design’ module giving an overview of six simulation scenarios. Bottom right: ‘Simulations’ tab of the ‘Design’ module summarising simulation results.

