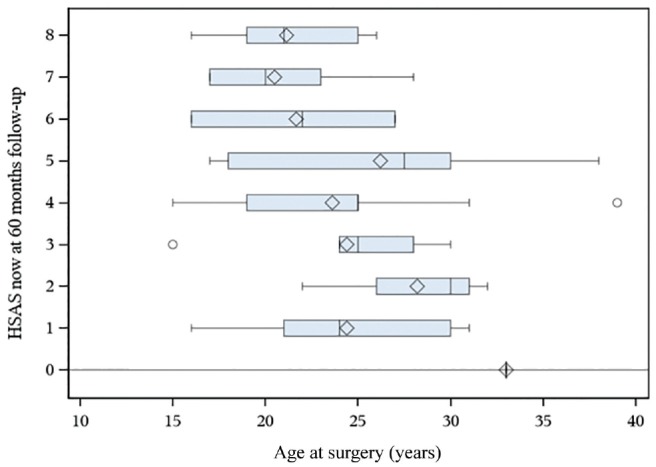
Figure 1.

A box plot comparing the Hip Sports Activity Scale (HSAS) with age at surgery. The box is displaying the spread of the data where the quadrant is the mean value and the line next to it shows the median value. The whiskers display the minimum and maximum quartile value, and the dot indicates whether there is an outlier.
