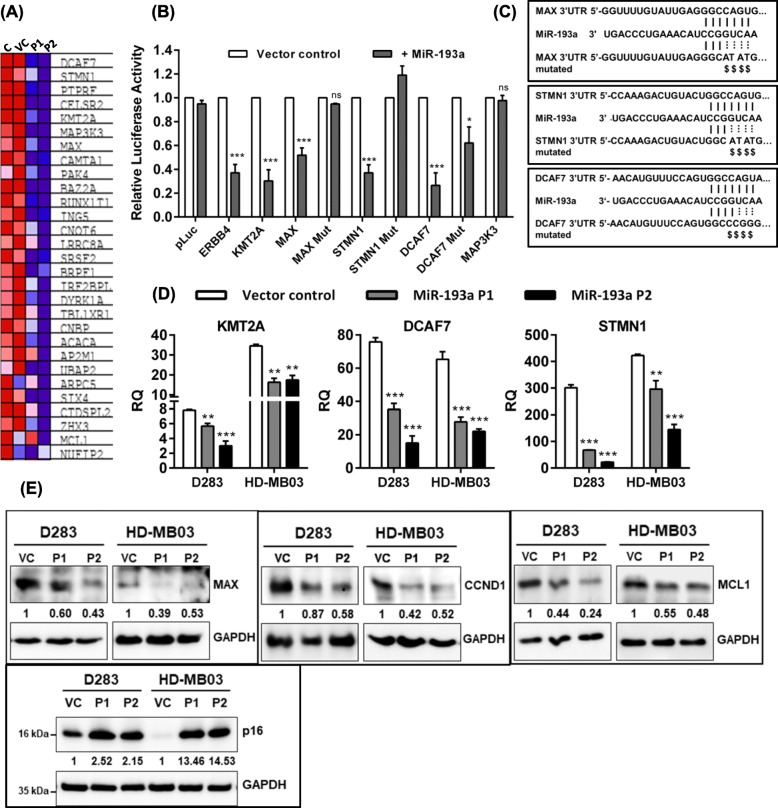
Fig. 4.
Identification of genes targeted by miR-193a by the transcriptome sequencing of the HD-MB03 medulloblastoma cells expressing miR-193a, validation of known and novel miR-193a targets. a GSEA analysis showed enrichment of miR-193a targets (Net Enrichment Score = 1.67; p = .003) in the genes differentially expressed upon the miR-193a expression as identified by the transcriptome sequencing. Heat map generated by this GSEA analysis shows downregulation of known and putative miR-193a targets in the P1, P2, the two independent cell populations expressing miR-193a as compared to the parental control [C] and the vector control [VC] cells. The expression values are represented as colors, where the range of colors (red, pink, light blue, dark blue) shows the range of expression values (high, moderate, low, lowest). b Y-axis denotes the relative activity of the luciferase reporter of the 3′-UTR construct of the indicated gene before and after miR-193a expression. Mut: Mutant 3′-UTR construct. c Mutations introduced in the miR-193a binding site by the site-directed mutagenesis in the 3′-UTR constructs of the indicated gene. d Real-time RT-PCR analysis of miR-193a target genes, upon doxycycline induction of miR-193a expression, in the P1 and P2 populations as compared to the doxycycline-treated vector control cells. e Western blot analysis of miR-193a targets MAX, CCND1, MCL1, and that of the cell cycle inhibitor p16 (CDKN2A) in the P1, P2 populations upon miR-193a expression as compared to the doxycycline-treated vector control cells. The expression levels of GAPDH, a housekeeping gene, were used as a loading control. The numbers below each blot indicate the fold change in the expression levels of the indicated gene in the P1, P2 population as compared to that in the vector control cells. *, **, *** and ns indicate p < 0.01, p < 0.001, p < 0.0001 and non-significant, respectively

