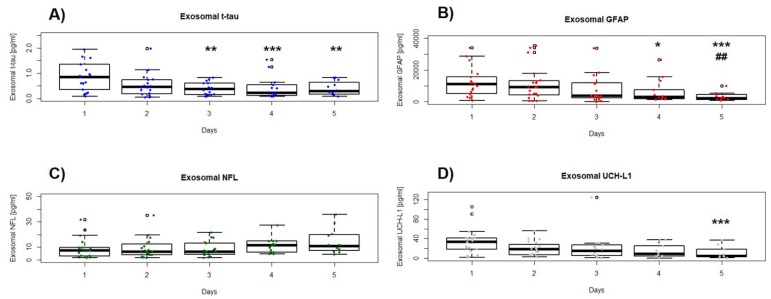
Figure 1.
Box and whisker plots of the median concentrations of serum exosomal (A) total-tau (t-tau), (B) glial fibrillary acidic protein (GFAP), (C) neurofilament light chain (NFL), and (D) ubiquitin carboxy-terminal hydrolase L1 (UCH-L1) over time study. The upper and lower bounds of each box indicate the 75th and 25th percentiles, respectively. Within each box, the horizontal line indicates the median. Whiskers extend to 1.5 × IQR. Significant differences are indicated with * p < 0.05, ** p < 0.01, *** p < 0.001 vs. day 1; ## p < 0.001 vs. day 2. For masking purposes, the displayed y-axis range for exosomal t-tau is 0–2.5 pg/mL (two outliers on day 1, and one on day 3 (not shown)), for exosomal GFAP is 0–40,000 pg/mL (one outlier on day 1, 3, and 5 (not shown)), and for exosomal NFL is 0–50 pg/mL (one outlier on day 1 (not shown)).

