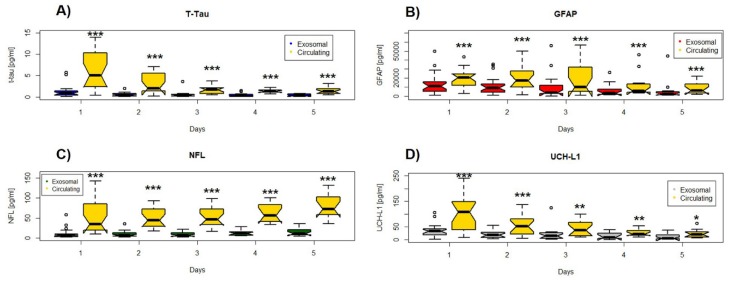
Figure 2.
Box and whisker plots of the median concentrations of serum and exosomal and circulating (A) t-tau, (B) GFAP, (C) NFL, and (D) UCH-L1 over time of the study. The upper and lower bounds of each box indicate the 75th and 25th percentiles, respectively. Within each box, the horizontal line indicates the median. Whiskers extend to 1.5 × IQR. Significant differences are indicated with * p < 0.05, ** p < 0.01, *** p < 0.001.

