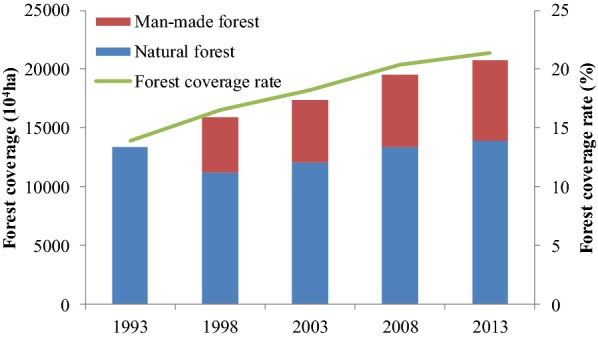
Fig. 5.

Annual forest coverage and its rate between 1993 and 2013 (red rectangular represents man-made forest and blue rectangular represents natural forest. Forest coverage contains both man-made and natural forestss)
Source: Main Results of the Eighth National Inventory of Forest Resources (1993–2013) [57, 58]
