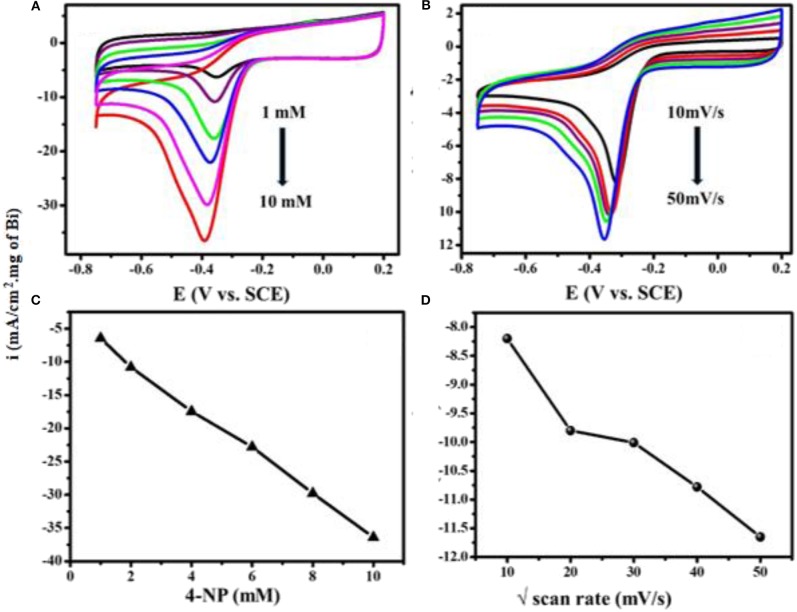
Figure 6.
Superimposed CV curves of Bi2O3@MWCNTs in 0.5 M H2SO4 (A) at different concentrations from 1 mM to 10 mM of 4-NP at a scan rate of 50 mV/s (B) at different scan rates (10–50 mV/s) for 4 mM of 4-NP. (C) shows the linear fit for peak current density vs. concentration and (D) linear fit peak for the scan rate of 4-NP on Bi2O3@MWCNTs (current density is normalized with loading of Bi2O3 NPs in Bi2O3@ MWNTs calculated from TG analysis).

