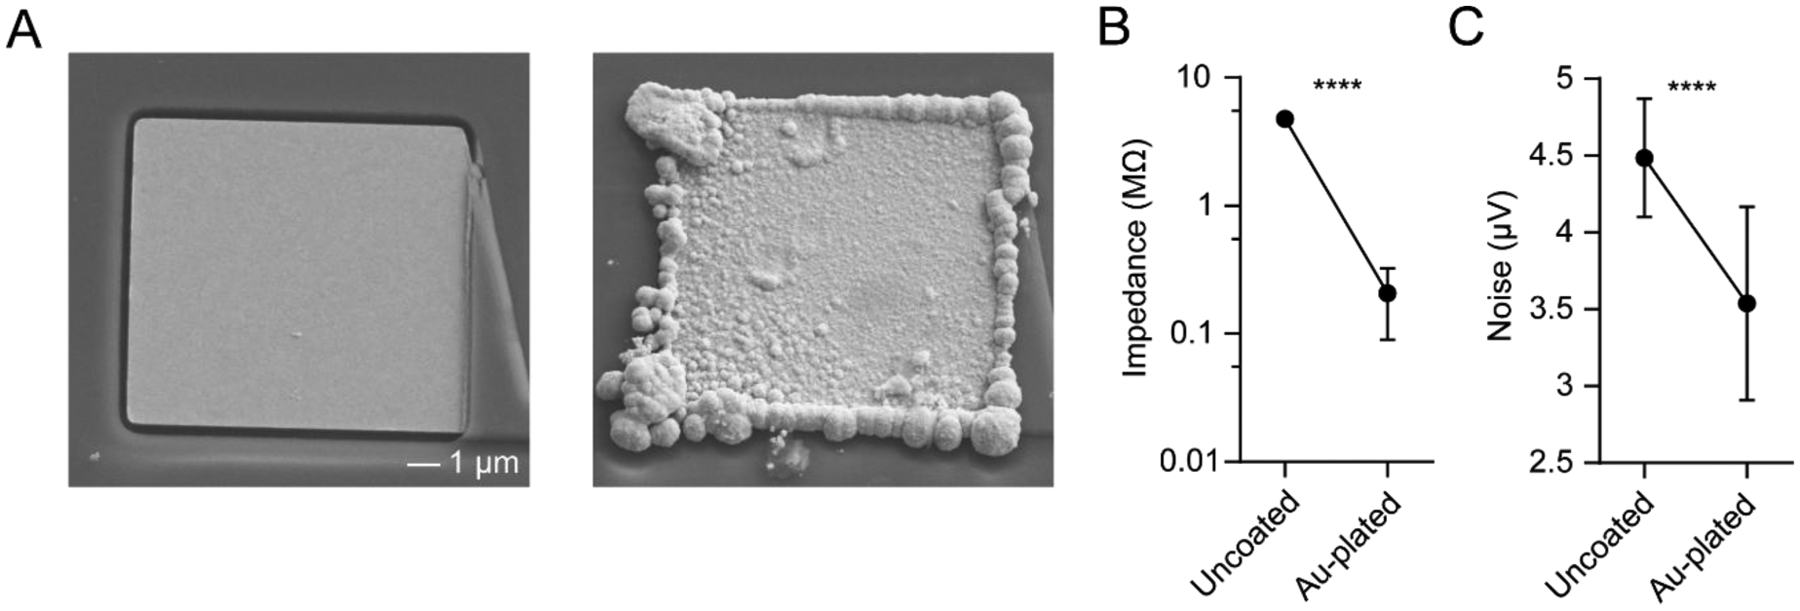
Figure 6. Device electroplating and noise characterization.

(A) Scanning electron microscope image of an uncoated (left) and gold-plated (right) electrode.
(B) Impedance of 128 electrodes before and after electroplating, measured at 1 kHz in saline (paired t-test, p < 0.0001).
(C) Root mean square noise of 128 electrodes before and after electroplating, measured in saline after applying a 0.3 – 7 kHz bandpass filter (paired t-test, p < 0.0001). Values in B and C represent mean ± SD.
